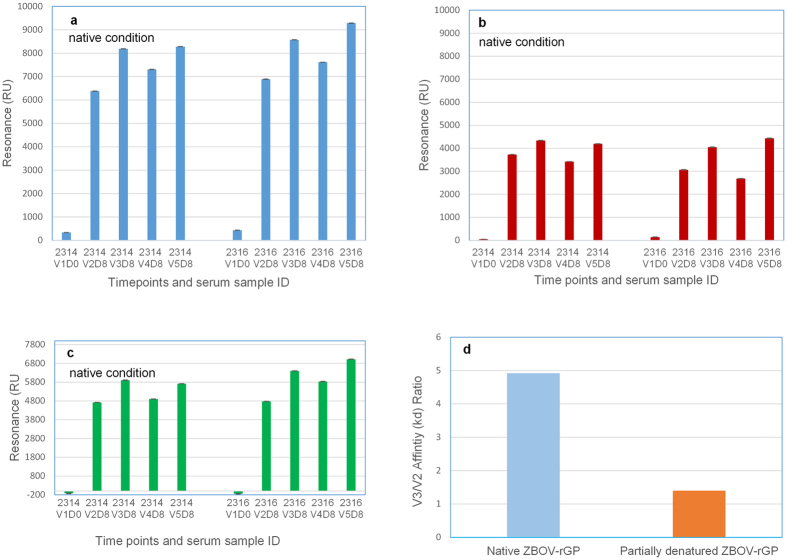
Figure 3. Affinity of anti-EBOV antibody for rGP proteins measured by SPR.
Steady-state equilibrium analysis of the binding of Tc bovine IgG preparations to different rGP proteins was measured under native conditions (rGP proteins immobilized on a HTG sensor chip). (a) total binding of antibodies to EBOV-GP; (b) total binding of antibodies to SUDV-GP; and (c) total binding of antibodies to EBOV N-terminal half of GP (1–308 residues) containing receptor binding domain. Student’s T-test method was used for analysis of affinity data. (d) Increase in antibody affinity from V2 to V3 as measured by SPR. Antibody affinity (off-rate constants, kd) to EBOV-GP were determined under native and partially denatured conditions. V3/V2 affinity (kd) ratios of antibody binding to native (left column) or partially denatured rGP (right column) shown are calculated by dividing the kd of V3 by kd of V2 for antibody binding to native or partially denatured rGP, separately.

