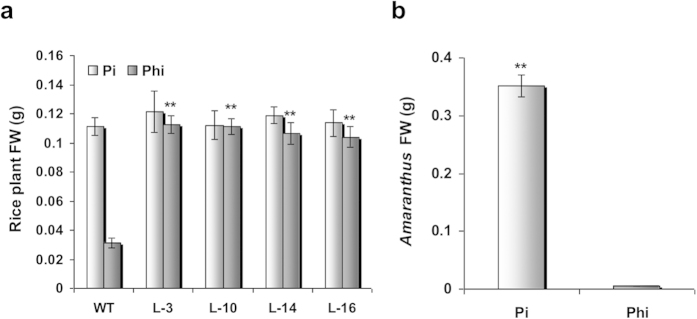
Figure 7. Comparison of biomass accumulation in plants under Pi or Phi treatment.
(a) The histogram representing total biomass production in WT and transgenic rice lines (L-3, L-10, L-14 and L-16) in response to Pi or Phi treatment. (b) The histogram representing total biomass production in A. spinosus grown under Pi or Phi supplementation. The graphs indicate mean fresh weight of 8 seedlings ± SEM.

