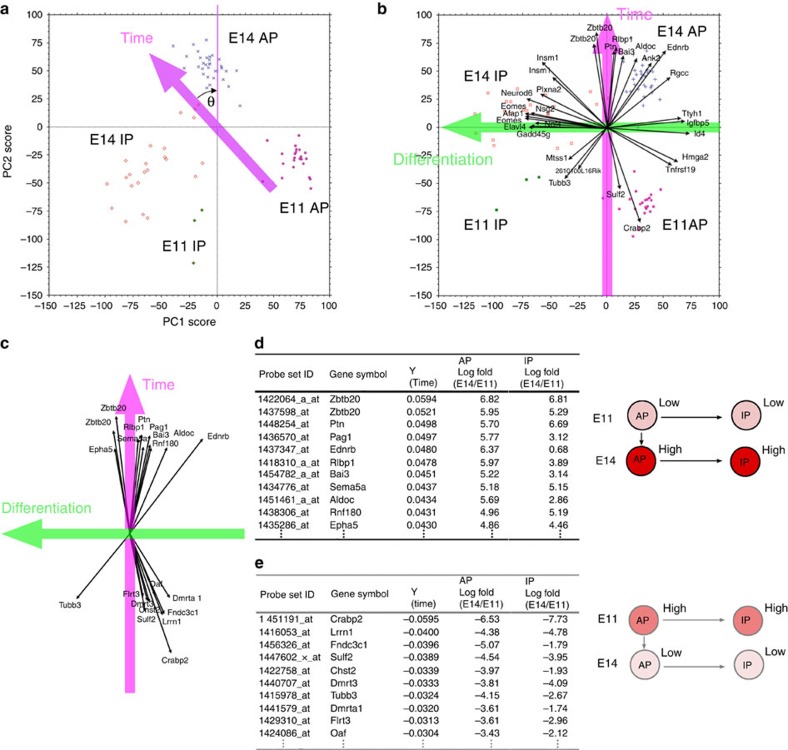
Figure 3. Expression change in an individual gene can be described by the temporal and differentiation axes.
(a) PCA was performed using microarray data from single-cell cDNAs of E11 and E14 progenitor (AP+IP) cells (E11, N=23; E14, N=56; 17,192 probe sets). Each symbol represents one cell. Plots for individual cells, categorized into one of four groups (E11 APs, E11 IPs, E14 APs and E14 IPs), are almost completely separated in a two-dimensional PCA graph. To make the new Y axis the temporal axis, graph a was rotated such that the median new X values of E11 APs and E14 APs were equal (θ≈43.35°) (graph b). (b) Distribution of four progenitor groups and vectors of the 30 genes with the largest vectors showed that the new X axis primarily reflects differences between APs and IPs, and thus represents the differentiation axis. (c–e) Temporal-axis genes. The top 10 genes that made the largest positive or negative contributions to the temporal axis were selected and shown as a vector (c) or in tables (d,e). These genes roughly overlapped with the main PC1 genes from PCA of E11, E14, and E16 APs (Fig. 2c). Log fold-change values of expression levels showed that these genes exhibited an E11-low/E14-high pattern (or vice versa) in both APs and IPs.

