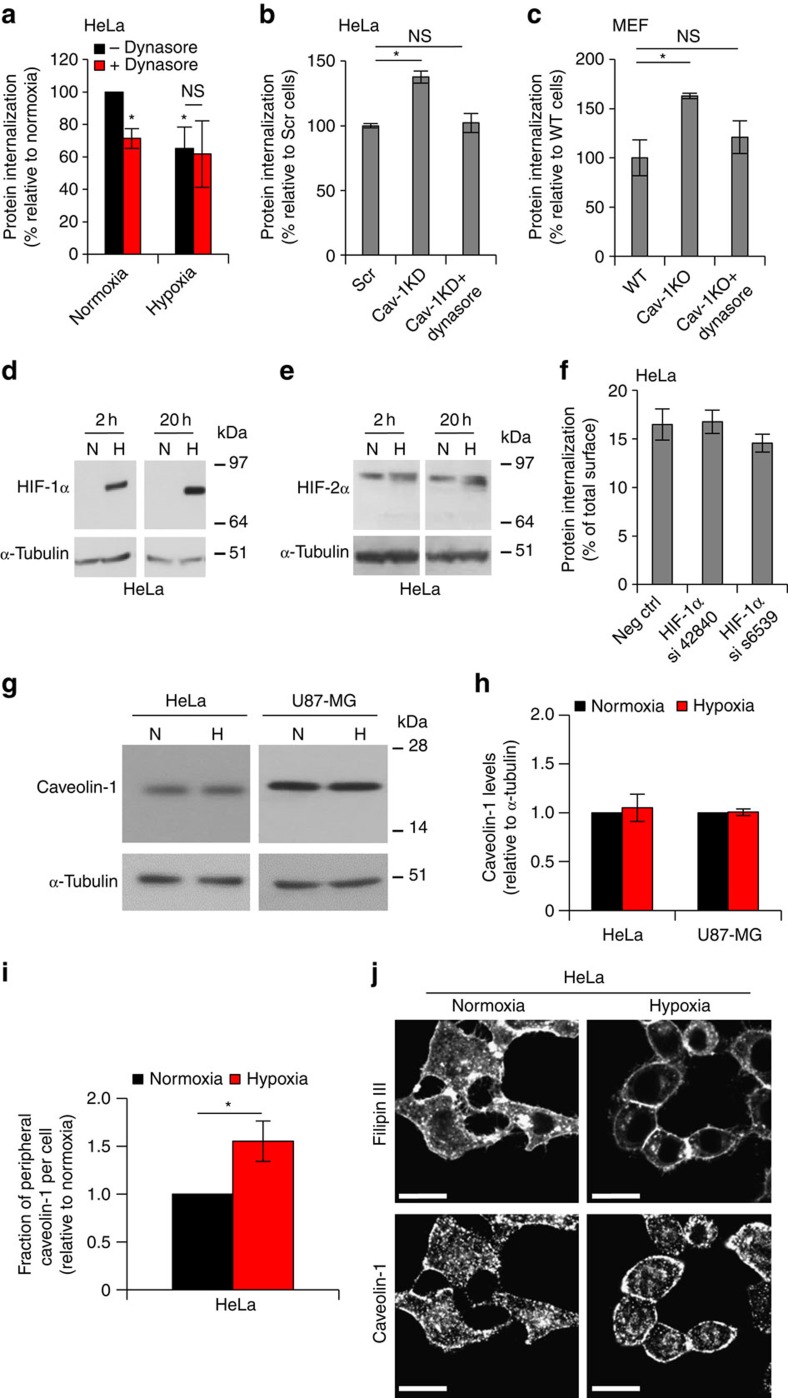
Figure 4. Caveolin-1 regulates dynamin-dependent endocytosis and is distributed to the cell periphery in hypoxia.
(a) Dynamin inhibition mimics hypoxia. FACS quantification of constitutive biotinylated membrane protein endocytosis at 30 min in normoxic and hypoxic HeLa cells following no treatment (–Dynasore) or pre-treatment with dynamin inhibitor Dynasore (+Dynasore) for 30 min. (b) FACS quantification of the endocytosed proteome in hypoxic control (Scr) and caveolin-1 knockdown (Cav-1 KD) HeLa cells with and without Dynasore pre-treatment shows that dynamin inhibition reverses the effect of caveolin-1 deficiency. (c) Similar experiment as in (b) with WT and caveolin-1 knockout (Cav-1 KO) MEF cells. (a–c) Data are presented as % relative to respective controls±s.d. (n=3). *P<0.05 (Student's t-test). (d) HIF-1α and (e) HIF-2α in HeLa cell lysates from normoxic and hypoxic conditions at the indicated time points were analysed by western blotting with tubulin as loading control. (f) FACS quantification of the endocytosed proteome at 2 h of hypoxia in HIF-1α KD (using two different HIF-1α siRNA sequences, as indicated) and control HeLa cells transfected with a scrambled siRNA sequence (Neg Ctrl) shows no significant effect of HIF-1α. Data are presented as % of total cell-surface biotinylation±s.d. (n=3). (g) HeLa and U87-MG cell lysates from normoxic and hypoxic conditions (2 h) were analysed for caveolin-1 by western blotting with tubulin as loading control. (h) Quantification of caveolin-1 to tubulin ratio in hypoxic versus normoxic cells (set to 1). Data represent the average±s.d. from three independent experiments. *P<0.05 (Student's t-test). (i) Normoxic and hypoxic (2 h) cells were stained for caveolin-1, and filipin as a cell membrane counter-stain. Cell per cell analysis of peripheral, plasma membrane associated caveolin-1 as a fraction of total caveolin-1 was performed using Image J. Data are presented as the fraction of peripheral caveolin-1 per cell in random fields (n=51 per condition) in hypoxia relative to normoxia (set to 1) from three independent experiments. *P<0.05 (Student's t-test). (j) Shown are representative images of the experiment quantified in (i). Scale bar, 20 μm.

