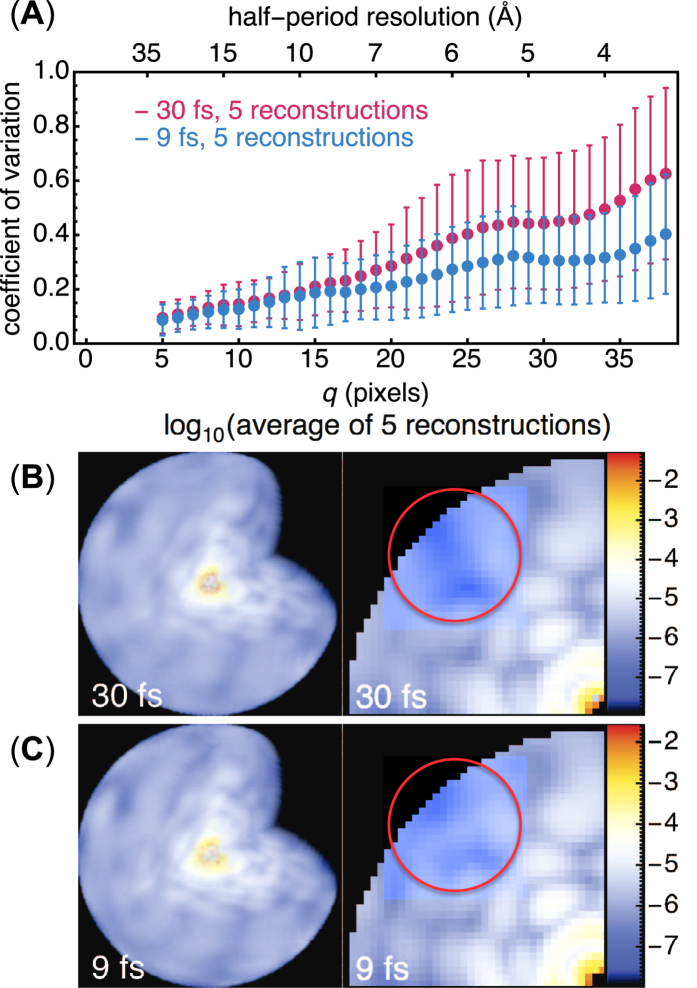
Figure 6. Reconstructed diffraction intensities vary more with longer pulses.
We show the coefficient of variation, σ(q = q) in (1), between different reconstructions of the 3D diffraction volume (773 voxels) for the 30 fs and 9 fs cases, both with 200,000 photon patterns containing Compton scattering. (A) The twice-averaged σ(q), once over the five reconstructed volumes in each case then again over resolution shells q = q, are labelled by filled circles, with error bars showing the standard deviations in this average. There is clearly greater variation in the intensities reconstructed at higher q for the longer pulse. (B,C) Cutaway 3D views (left) and their central sections (right) of the logarithm of their average reconstructed intensities. Loss in speckle contrast at higher spatial frequencies (encircled in red) is more severe with longer pulses.

