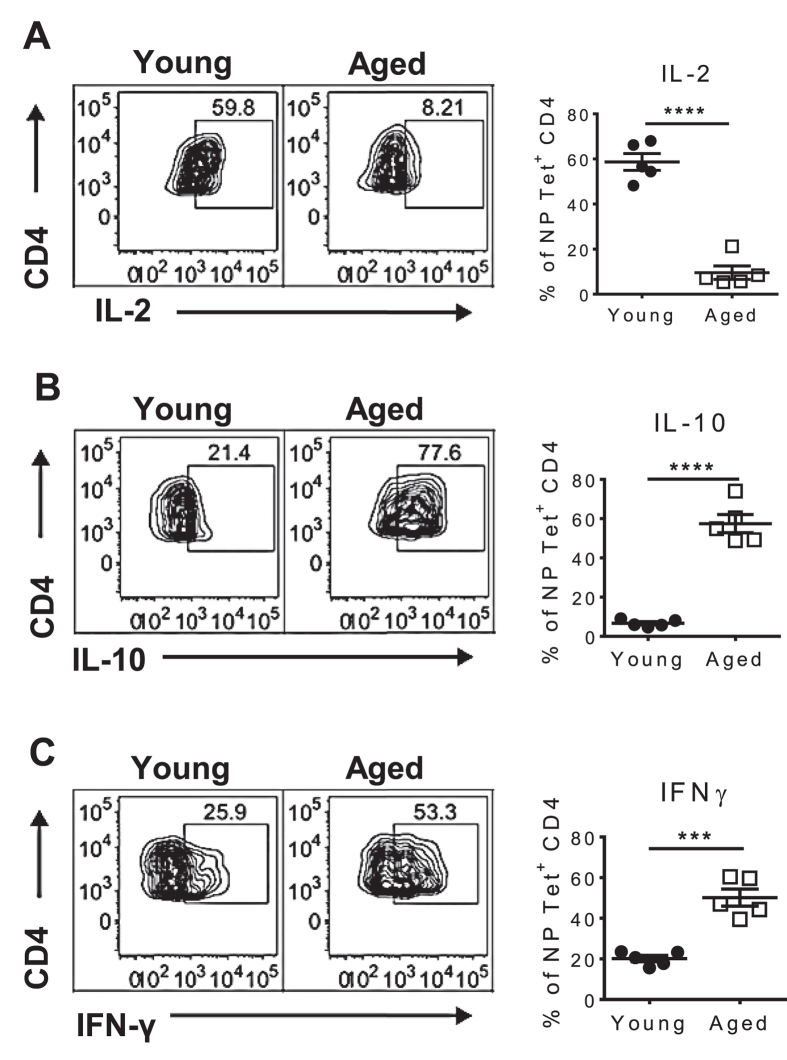
Figure 5. NP-specific CD4+ T cells produce cytokines indicative of regulatory T cells.
Intracellular cytokine staining of young and aged NP Tet+ CD4+ T cells harvested 7 dpi and stimulated with PMA/Ionomycin. The graphs show the mean ± SEM of the frequency of NP-specific CD4+ T cells producing: (A) IL-2, (B) IL-10, and (C) IFNγ. The data are from 5 mice/group of one representative experiment of two performed independently. Statistical significance was determined by Student’s t test. ***p < 0.001; ****p < 0.0001.

