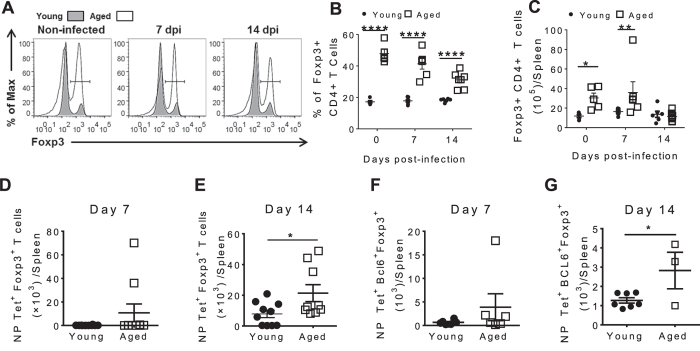
Figure 6. T regulatory and T follicular regulatory cells accumulate in aged mice after influenza infection.
(A) Representative histograms of total CD4+ T cells expressing Foxp3 in young and aged mice. Frequency (B) and number (C) of total CD4+ T cells that express Foxp3 in spleens from young and aged mice before influenza infection, 7dpi and 14dpi. Number of NP-specific CD4+ T cells expressing Foxp3 in the spleen of young and aged mice at (D) 7 dpi and (E) 14 dpi. Number of NP-specific CD4+ CXCR5hi PD-1hi Bcl6+ Foxp3+ cells in spleens of young and aged mice at (F) 7 dpi and (G) 14 dpi. Data are the mean ± SEM of 3–10 mice per group from a representative experiment of 3 performed independently. Statistical significance was determined by Two way ANOVA with LSD post test (B,C) or Student’s t test (D–G). *p < 0.05, p < 0.001.

