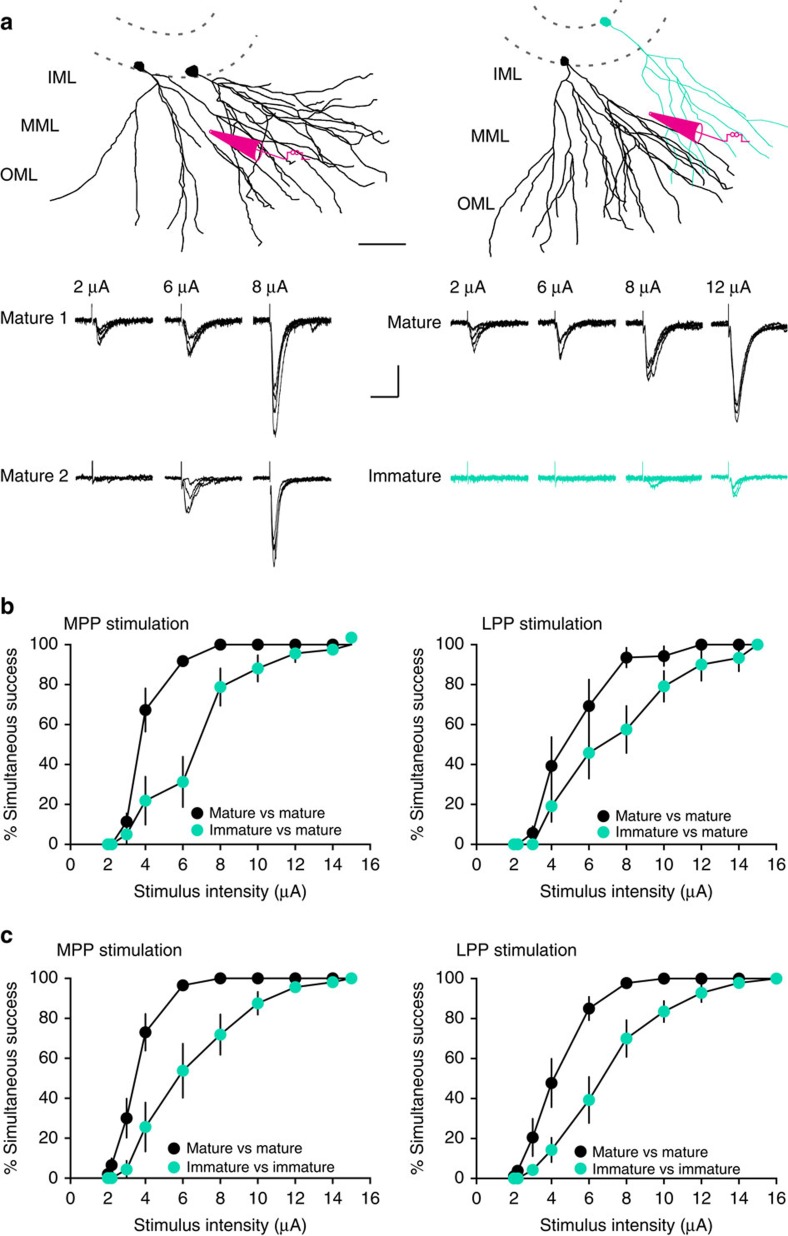
Figure 6. Less overlap of synaptic inputs to immature GCs.
(a, top) Reconstructions of two mature GCs (black, left) or a mature and an immature GC (teal, right) showing the approximate placement of the stimulating electrode. Scale bar, 50 μm. (bottom) The percentage of trials with simultaneous EPSCs in both cells (% simultaneous success) was measured at increasing stimulus intensities (20 trials at each intensity). Examples are from MPP stimulation. Scale bar, 20 pA, 40 ms. (b) The percentage simultaneous success versus stimulus intensity is shown for MPP stimulation (left) and LPP stimulation (right). The percentage simultaneous success for pairs of mature with immature teal symbols) was different from pairs of two mature GCs (black symbols) at multiple stimulation intensities. This suggests more active fibres were required to recruit overlapping synaptic inputs in pairs with an immature GC. Repeated measure two-way ANOVA, MPP, n=8–11 cell pairs per group: factor cell age, F(1,17)=14.6, P=0.0013; factor stimulus, F(9,153)=173.2, P<0.0001; Interaction, F(9,153)=10.6, P<0.0001. LPP, n=6–7 cell pairs per group: factor cell age, F(1,11)=6.3 P=0.04; factor stimulus, F(9,99)=98.7, P<0.0001; Interaction, F(9,99)=3.2, P=0.031. (c) The % simultaneous success for pairs of two immature GCs (teal) was different from pairs of two mature GCs (black symbols) at multiple stimulation intensities, indicated less overlap in synaptic inputs between immature GCs. Repeated measure two-way ANOVA, MPP, n=10–8 cell pairs per group: factor cell age, F(1,16)=16.1, P=0.001; factor stimulus, F(9,144)=131.9, P<0.0001; and interaction, F(9,144)=6.11, P<0.0001. LPP, n=9–7 cell pairs per group: factor cell age, F(1,14)=16.7, P=0.001; factor stimulus, F(9,126)=138.2, P<0.0001; and interaction, F(9,126)=4.8, P<0.0001. ANOVA, analysis of variance. Inner molecular layer (IML); middle molecular layer (MML); outer molecular layer (OML).

