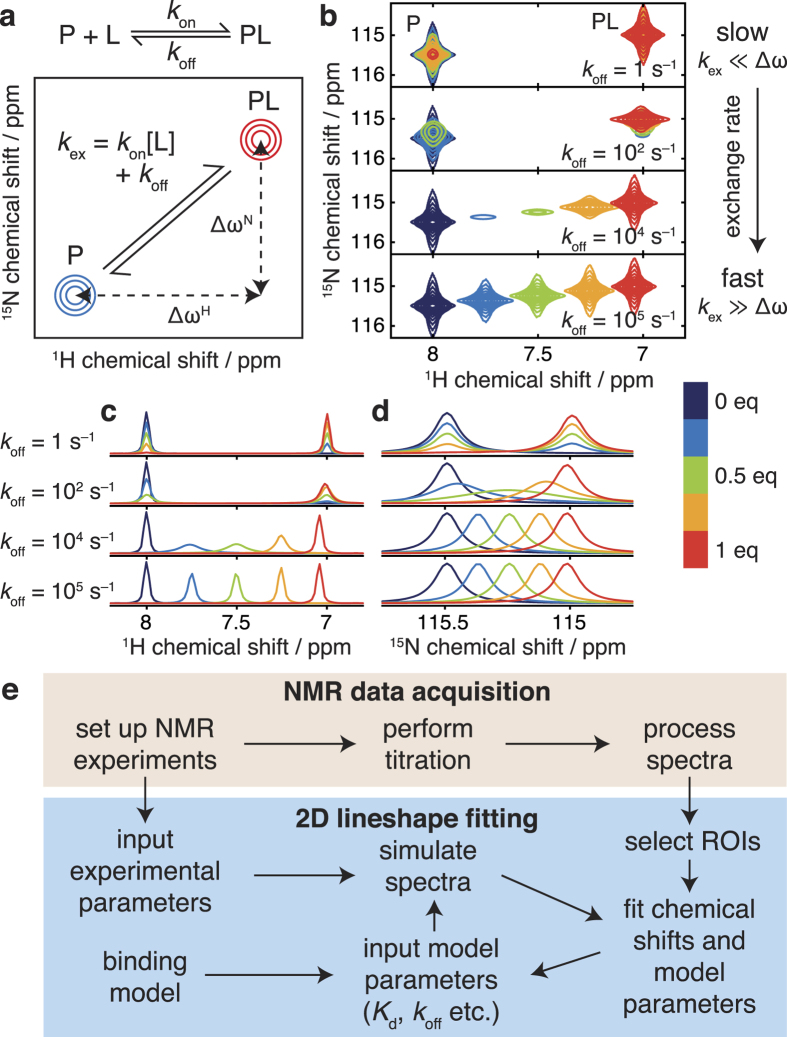
Figure 1. Principles of two-dimensional lineshape analysis.
(a) Schematic showing the definition of the exchange rate and frequency differences for a two-state protein-ligand interaction. (b) Simulated 1H, 15N-HSQC spectra for a protein-ligand interaction (700 MHz, 1 mM protein concentration, Kd 2 μM, ΔωH 4400 s−1, ΔωN 220 s−1) illustrating two-dimensional lineshapes that may arise under various exchange regimes. Contour levels are constant across all spectra. (c,d) 1H and 15N projections of HSQC spectra shown in Fig. 1b, normalised by integration. (e) Outline of the data acquisition process and the two-dimensional lineshape analysis procedure. ROIs, regions of interest.

