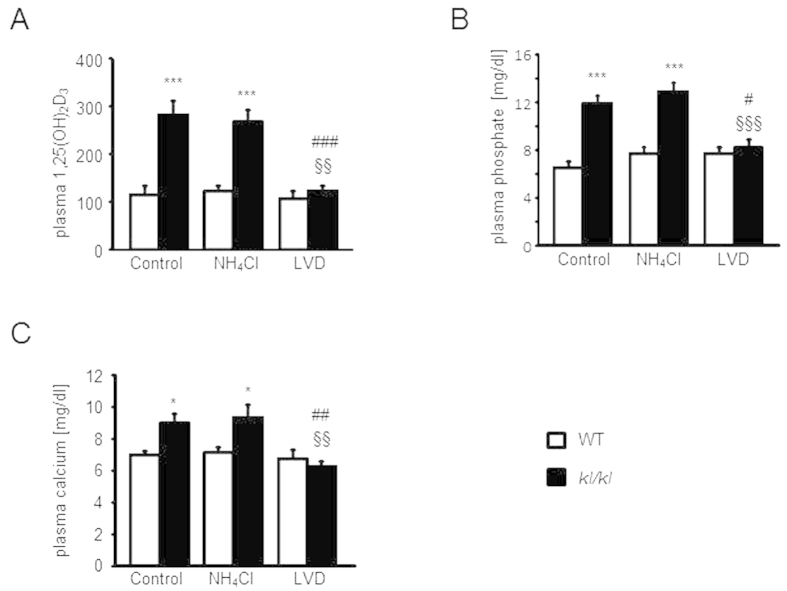
Figure 2. Effect of NH4Cl treatment and low vitamin D diet on plasma 1,25(OH)2D3, phosphate, and Ca2+ concentrations of wild-type mice and kl/kl mice.
(A–C) Arithmetic means ± SEM of (A) plasma 1,25(OH)2D3 (n = 6), (B) phosphate (n = 12), and (C) Ca2+ (n = 12) concentrations of wild-type mice (WT, white bars) and kl/kl mice (black bars) either untreated, treated with NH4Cl solution (280 mM in drinking water) or treated with NH4Cl and vitamin D deficient diet (LVD, right bars). ***(p < 0.001) indicates statistically significant differences from respective wild-type mice (WT); #(p < 0.05), ##(p < 0.01), ###(p < 0.001) indicates statistically significant differences from untreated kl/kl mice; §§(p < 0.01), §§§(p < 0.001) indicates statistically significant differences from respective NH4Cl treated mice on control diet. (ANOVA).

