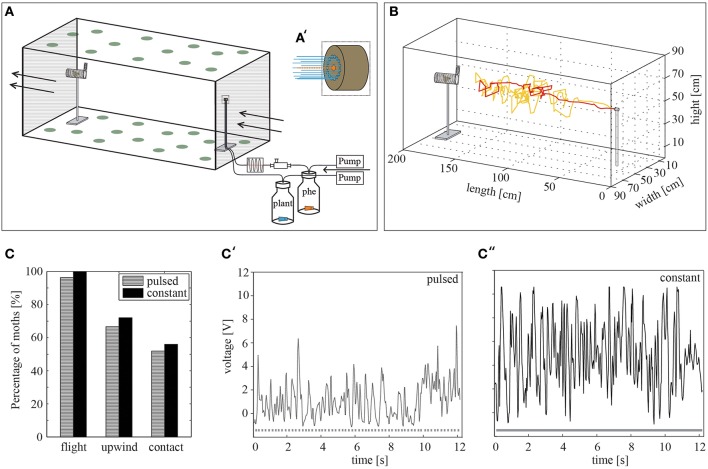
Figure 1.
The wind tunnel system. (A) Schematic representation of the wind tunnel system including the stimulus device. The ceiling and the floor were covered by green dots in order to provide a pattern for the insects to orient on. Arrows indicate the air stream. An air flow is transported via pumps through the stimulus bottles and released by the stimulus outlet. The pheromone-loaded air is pulsed beforehand at 10 Hz by using a cross-valve. phe = pheromone (A') Magnification of the stimulus outlet (dashed square). The dotted orange line represents the middle nozzle, which emits a pulsed pheromone stimulus, while the blue lines highlight the constant plant odor flow released by the surrounding nozzles. (B) Two representative flights of different males (yellow, red) toward the pheromone blend. (C) The percentage of male H. virescens attempting flight behavior, achieving upwind flight and making source contact is similar for constant (N = 25) and pulsed (N = 27) pheromone stimulation (p > 0.05, Fisher's exact test). (C',C″) Visualization of the constant and pulsed odor plume using a photoionization detector (PID) at 110 cm distance from the stimulus outlet. Dotted and continuous lines below the curves represent the odor stimulation. Fewer volatiles can be detected in the pulsed (C′) odor plume than in the constant plume (C′'). PID measurements: Upulsed = 1.81 V, Uconstant = 4.77 V.

