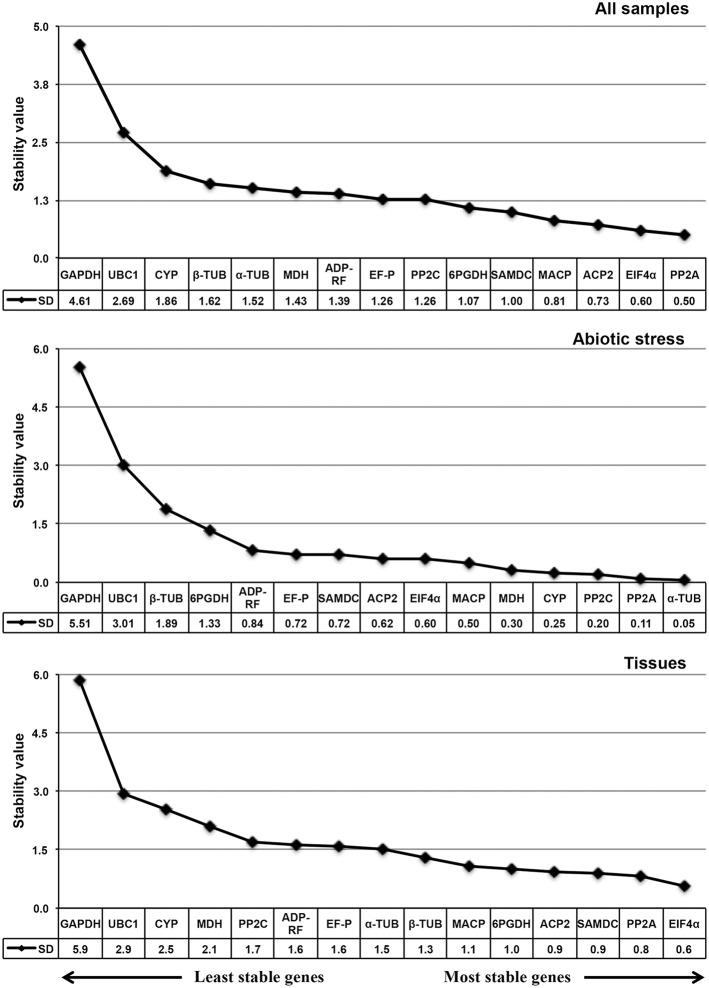
Figure 5.
NormFinder expression stability values and candidate reference gene ranking in Sorghum bicolor samples. Lower values indicate greater stability and larger values indicate the least stable reference genes. The direction of the arrow indicates the most and least stable reference genes. The most stable genes are listed on the right and the least stable are listed on the left.

