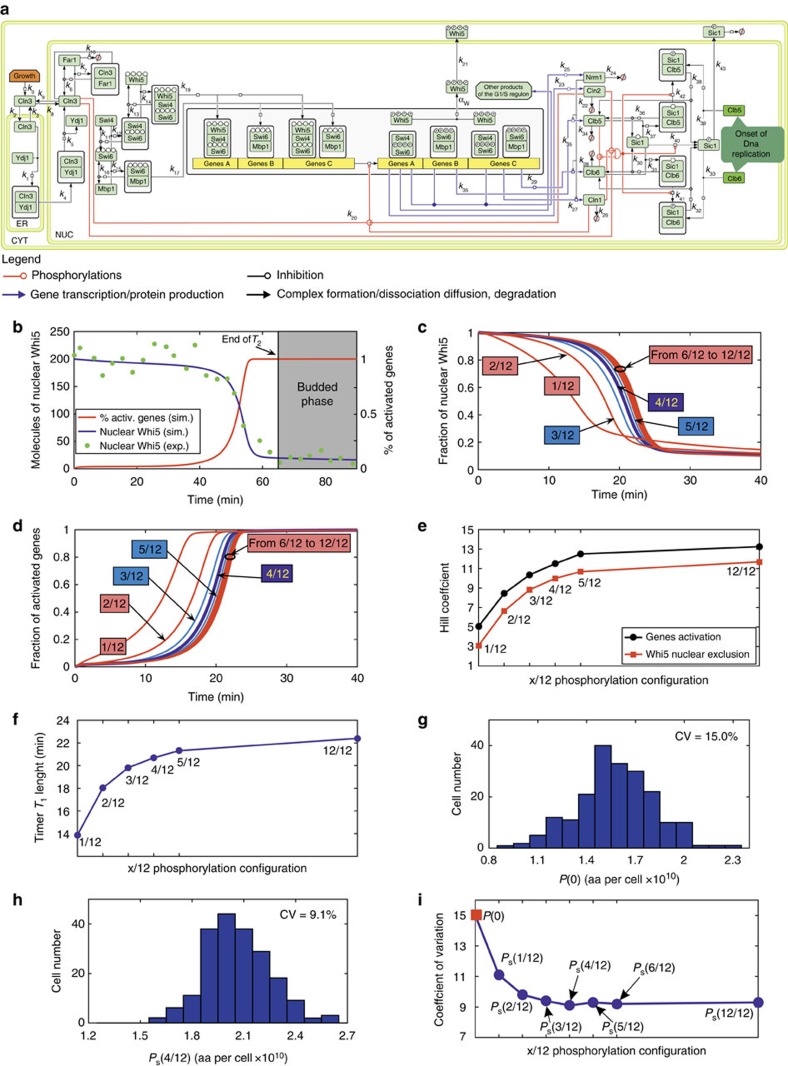
Figure 1. Multisite Whi5 phosphorylation controls the G1/S transition.
(a) Map of the molecular processes regulating the G1/S transition. The box labelled ‘Growth' accounts for the growth equations (written in terms of the overall cell protein and ribosome amount) driving the molecular model. (b) Time course of the fraction of the activated genes of the G1/S regulon (red line) and the number of nuclear Whi5 molecules (blue line), obtained from the simulation of an extra-small daughter cell (P(0)=1.2*1010 aa, R(0)=1.6 × 10⁵ rib), fitting experimental Whi5 values from ref. 29. aa, amino acids. (c,d) Time course of the fraction of nuclear Whi5 (c) and of the activation of the G1/S regulon genes (d), obtained from the simulation of an average daughter cell according to different multisite phosphorylation schemes (12 total Whi5 phosphorylation sites, 1 to 12 functional sites). (e) Hill coefficients of the best-fitting Hill function for the curves reported in c,d. (f) T1 length for the curves reported in c,d. (g,h) Size (protein content) distribution of newborn cells (g) and of cells at the beginning of the budded phase according to the 4/12 Whi5 phosphorylation configuration. The simulations were carried out by sampling the initial P(0) from a log-normal distribution (average value 1.6 × 10¹⁰ aa, CV 15%) and fixing R(0)=ρ × P(0). In each simulation, all the parameters were allowed to vary (log-normal distribution) with 5% CV over the average values (see Supplementary Table 10 for details). (i) Diagram of the CVs for the distributions of different phosphorylation schemes, same rules to assign parameters and initial conditions as in g,h (distributions reported in Supplementary Fig. 6).

