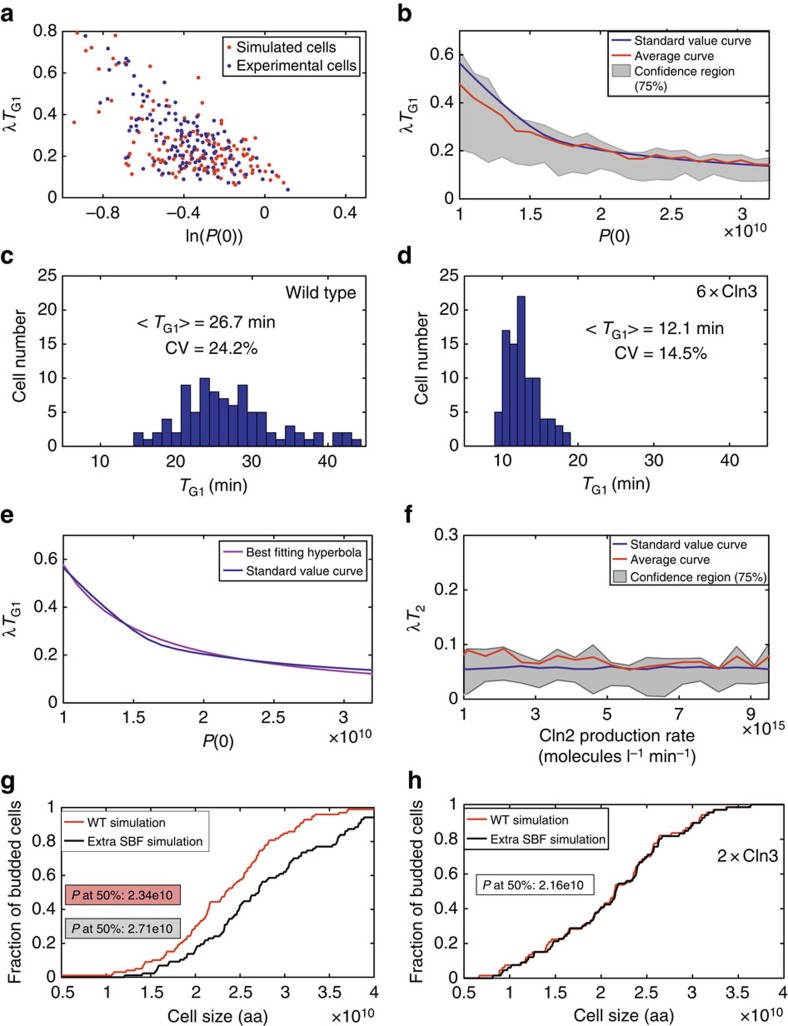
Figure 3. G1 duration in daughters born with different size.
(a) Correlation between λTG1 and ln(P(0)), with P(0) normalized to the average size at budding of the cell population. Experimental values (blue) from ref. 13, simulated data (red) refer to average and extra-small populations (see Supplementary Table 10 for the implementation details). A CV value of 20% was chosen for the initial protein distribution, given that the experimental sample to be compared with simulation results includes unusually small cells13. (b) Correlation between λTG1 and P(0). Twenty three cells differing only in their initial protein content were simulated (blue line). The red line refers to the average results of 50 separate cells in each initial condition, parameters allowed to vary as described in Supplementary Table 10. The 75% quantile region is in grey. (c,d) G1 phase length heterogeneity for wild-type cells (c) and cells overexpressing Cln3 (6 × over wild-type, d). (e) Best-fitting hyperbola for the standard value curve of λTG1 (blue line, b) versus the initial protein content P(0). (f) Correlation between λT2 and the Cln2 production rate. Twenty three cells differing only in their Cln2 production rate were simulated (blue line). The red line refers to the average results of 50 separate cells in each initial condition, with parameters that were allowed to vary as described in Supplementary Table 10. The 75% quantile region is in grey. (g,h) Fraction of budded cells versus cell size. (g) compares budding kinetics for wild-type cells and cells including extra SBF-binding sites; (h) compares the same two curves for cells overexpressing Cln3. See Supplementary Table 10 for implementation details.

