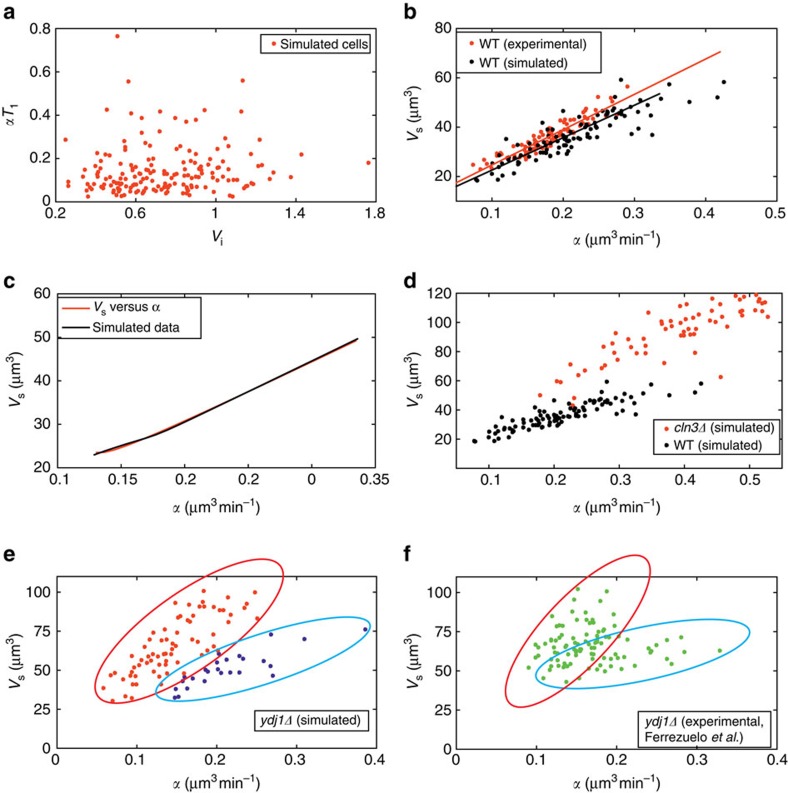
Figure 4. Linear growth rate and critical cell size.
(a) Correlation between the product αT1 and the initial volume Vi, 100 simulated cells. (b) Correlation between the volume at the end of T1 (Vs) and the linear volume growth rate (α). Each black point represents one cell from a population of 100 daughter cells. All parameters were allowed to vary (log-normal distribution) with a 12% CV over their average values (see Supplementary Table 10 for details). Red points are experimental data from ref. 29. (c) Volume at the end of T1 versus linear growth rate (α). The black line corresponds to the simulated data. The red line corresponds to the relationship of Vs versus α, which was determined by exploiting the best-fitting hyperbola of Fig. 3e between λTG1 and P(0). (d) Correlation between the volume at the end of T1 and the linear volume growth rate (α) for mutant cln3 (red) and WT cells (black circles, same data as in b). (e,f) Correlation between the volume at the end of T1 and the linear volume growth rate (α) for mutant ydj1 (simulated data in e, experimental data in f). In e, clusters refer to cells simulated according to growth parameters providing an exponential growth rate of 0.0031, min−1 (red cluster) or 0.0063, min−1 (blue cluster). In f, the red cluster refers to cells of the experimental sample reported in ref. 29 that fall within the grid of Supplementary Fig. 10C. The blue cluster comprises the remaining cells.

