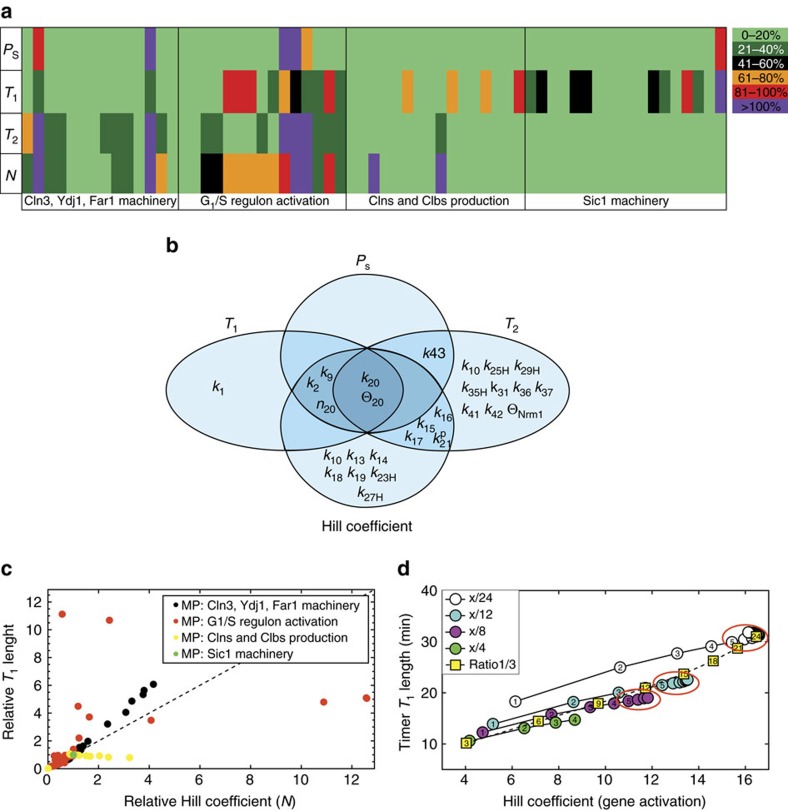
Figure 5. Parameter-sensitivity analysis.
(a) Heat map describing the effect of parameter variation on the outputs of the G1/S transition model. (b) Venn chart summarizing the parameters whose variation affects one or more outputs of the G1/S transition model. (c,d) Correlation analysis of the changes in T1 length as a function of the changes in the Hill coefficient N. Each point in c refers to a single-cell simulation in which one model parameter—colour-coded by functional class—was altered. The x and y axes are the relative output values, with the value of the standard parameter set to 1. The black dotted line represents the expected output for a 1-to-1 correlation. Each point in d refers to a single-cell simulation in which different Whi5 phosphorylation settings were considered. Coloured circles refer to simulation sets with a fixed total number of phosphorylation sites and a variable number of functional sites (indicated within the circle itself). Yellow boxes refer to simulation with fixed (1/3) ratio of functional/total phosphorylation sites. The total number of sites is indicated within the square.

