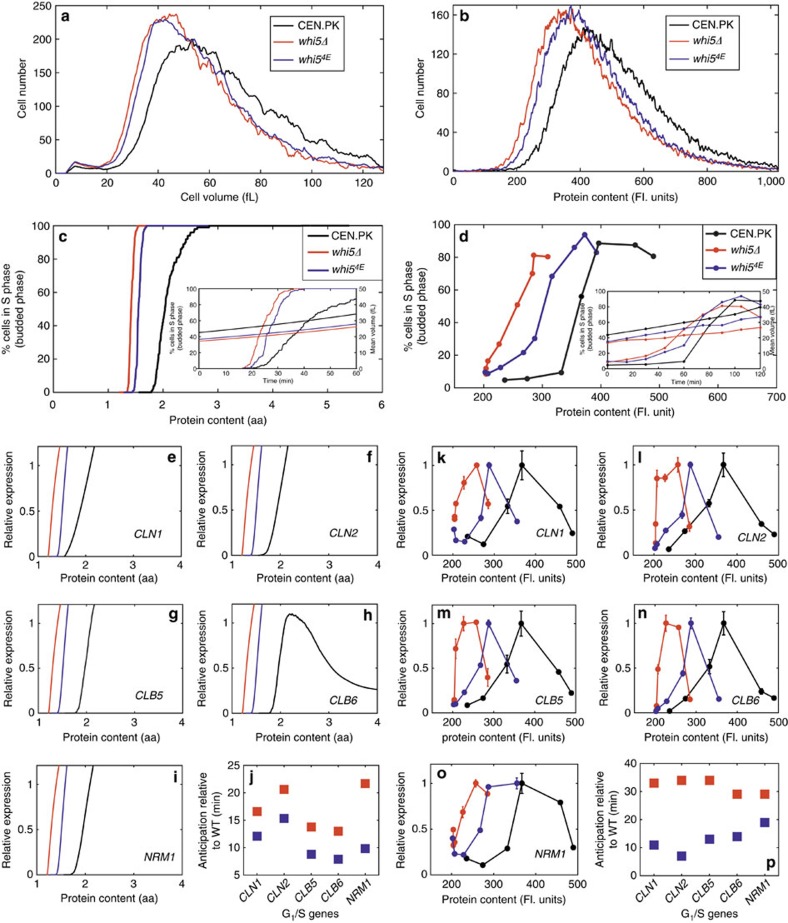
Figure 6. Whi54E mutant anticipates entrance into S phase.
(a,b) Cell volume and protein distributions of wild type, whi5Δ and whi54E cells exponentially growing in glucose-supplemented medium. Data representative from three independent experiments are shown. Predicted (c) and experimental (d) kinetics of cell cycle entry for wild type (black), whi5Δ (red) and whi54E (blue) cells. Predicted (e-j) and experimental (k-p) transcriptional activation of selected genes of the G1/S regulon in wild type (black), whi5Δ (red) and whi54E (blue) cells expressed as a function of cell size. Experimental data in k–p represent means±s.d.'s (n=3). Cell cycle entry and transcriptional activation are shown as a function of cell size; inserts in c,d show cell cycle entry expressed as a function of time (time 0 being reinoculation in fresh medium after elutriation). (j,p) summarize the time for which each gene anticipates the reaching of 50% expression in whi5Δ (red) and whi54E (blue) mutants in comparison with wild type.

