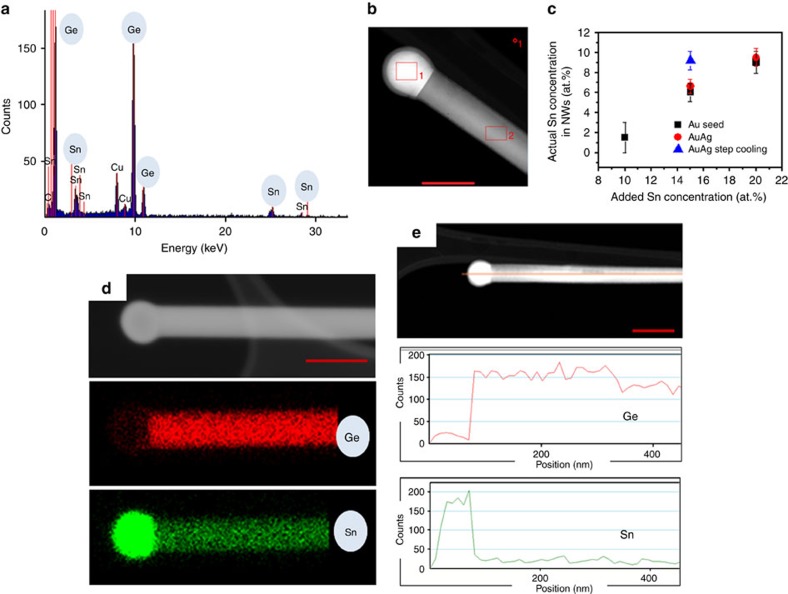
Figure 2. EDX analysis of Ge1−xSnx nanowires.
(a) EDX spectrum recorded from the body of an alloy nanowire (selected from the sample with 9.2 at.% average Sn incorporation) showing the presence of both Ge and Sn. This particular nanowire is shown in b. Scale bar, 50 nm. Variations in Sn concentration with different catalysts and growth conditions are demonstrated in c. Error bar indicates s.d. in EDX measurements measured over 50 nanowires. (d) Dark-field HAADF image and EDX mapping for Ge and Sn in a Ge1−xSnx nanowire with 9.4 at.% of Sn. HAADF image with the uniform distribution of Ge and Sn and Sn-rich catalyst is confirmed from EDX mapping and also from HAADF image and EDX linescan in e. Red curve denotes linescan for Ge, whereas green curve for Sn. Scale bar, 50 and 100 nm in d and e, respectively.

