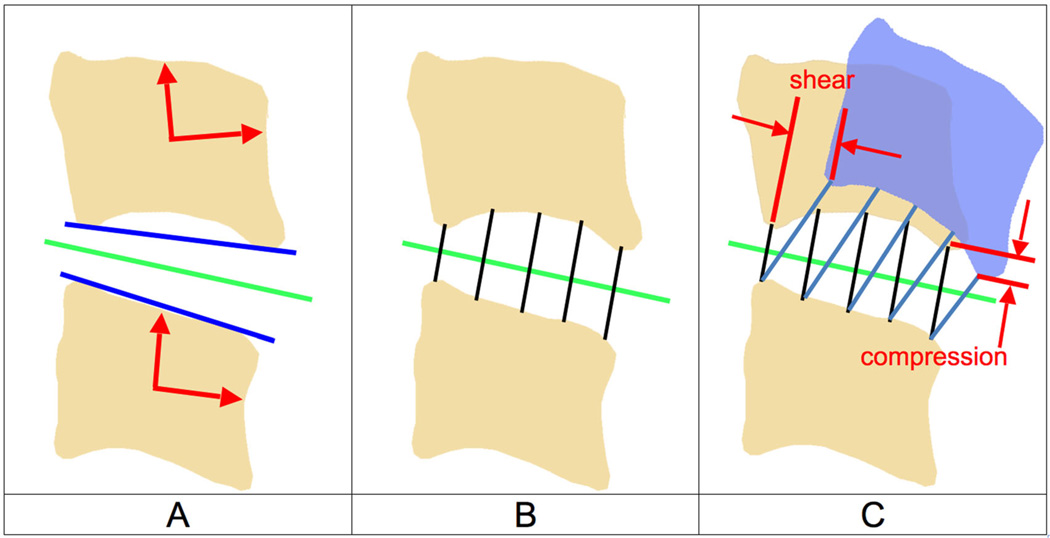
Figure 3.
Calculating disc height and disc deformation. (A) Anatomical coordinate systems were created in each bone and used to calculate the flexion–extension angle for each motion segment (red arrows). A line in the direction of the inferior endplate of the superior bone and a line in the direction of the superior endplate of the inferior bone in the sagittal plane were created (blue lines). The average direction of these two lines defined the average anterior–posterior (AP) axis of the disc in the static neutral position (green line). (B) Using the static neutral data, line segments connecting the endplates and perpendicular to the average disc AP axis were constructed (over 100 per disc; only five are shown for clarity). The average disc height within each region was determined from this static neutral data. (C) The endpoints of each line segment remained connected to each bone during the dynamic motion (blue bone). Disc deformation parallel to the disc static AP axis (shear) and perpendicular to the static disc AP axis (compression–distraction) was determined for each line segment. All measurements were performed in three-dimensions, but only the sagittal plane is shown for clarity.

