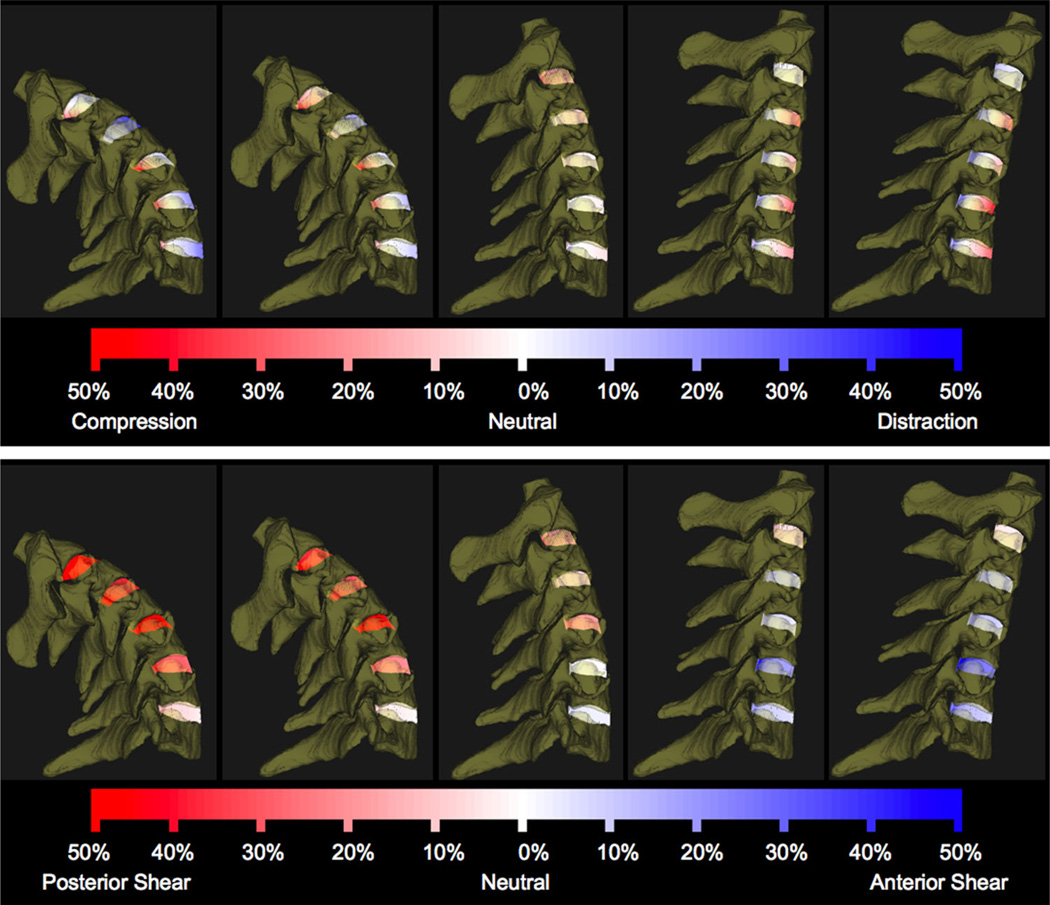
Figure 4.
C23–C67 disc compression–distraction deformation (above) and shear deformation (below) during dynamic flexion–extension for a representative participant. A series of five instants from the flexion portion of the dynamic trial are shown for demonstration purposes. Line segments connecting bone endplates are color-coded according to percent compression–distraction (above) and shear (below) deformation relative to the static neutral position.

