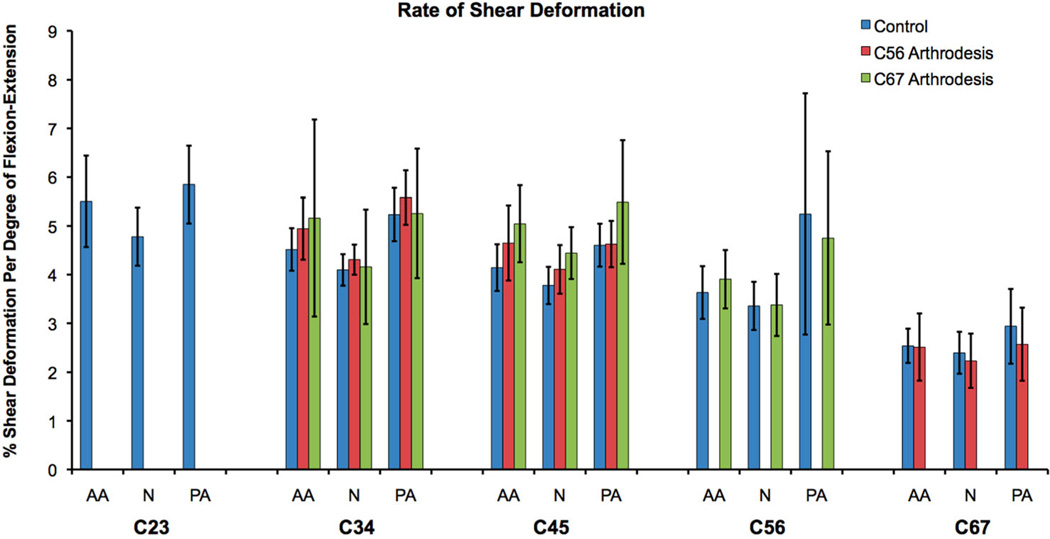
Figure 6.
Average rate of disc shear deformation in the anterior annulus (AA), nucleus (N), and posterior annulus (PA) for each cervical disc. Error bars indicate upper and lower 95% confidence intervals for the mean of each group. C23 disc data were not available for the arthrodesis groups. For the control group, the rate of C67 shear deformation in each disc region was significantly less than corresponding regions of all other discs. Control and arthrodesis groups were not significantly different at any disc region.

