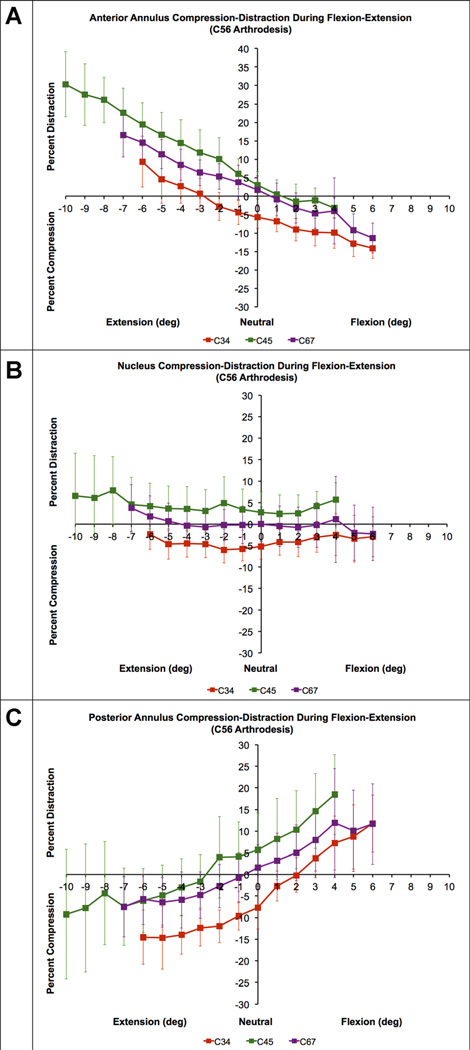
Figure 8.
Mean disc compression–distraction deformation in the anterior annulus (A), nucleus (B) and posterior annulus (C) during flexion–extension in C56 arthrodesis patients (n = 10). Disc compression-distraction, expressed as a percentage of disc height in the static neutral position, is plotted on the vertical axis. Intervertebral flexion–extension angle, normalized to the static neutral position, is plotted on the horizontal axis. Error bars indicate inter-subject variability (i.e., 95% confidence interval at each disc level). Note that only C45 disc curves are shifted toward distraction in comparison to asymptomatic controls (Fig. 5).

