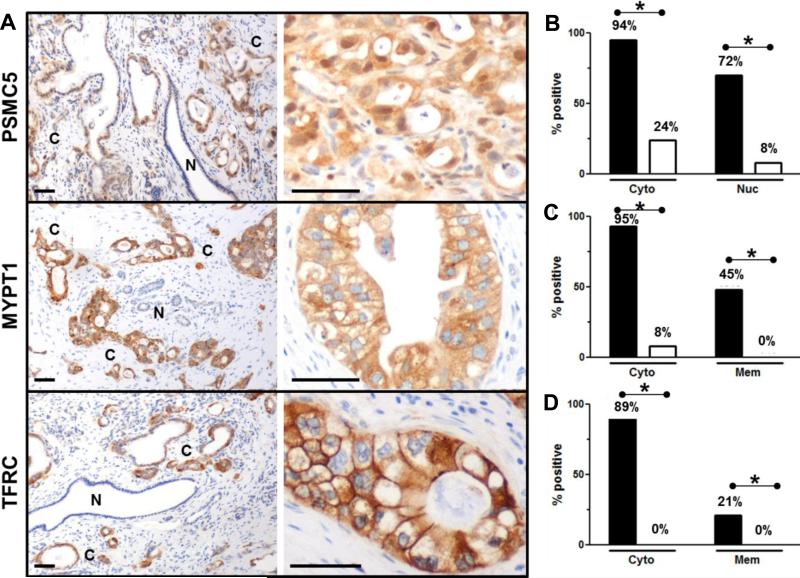
Figure 3. Increased tissue expression of PSMC5, MYPT1 and TFRC parallels PDA development.
Representative tissue sections from the J9988 study stained for (A) PSMC5, MYPT1 and TFRC are shown. Normal non-neoplastic duct cells (indicated with an N) and cancer cells (indicated with a C). Scale bars = 50 μm. Staining summary for (B) PSMC5 (n = 45), (C) MYPT1 (n = 44) and (D) TFRC (n = 42). PDA glands (black bars) express PSMC5, MYPT1 and TFRC in both cytoplasm and nucleus/membrane. However, minimal staining is evident in non-neoplastic (white bars) pancreatic ducts. *P < 0.01 Fisher exact test.

