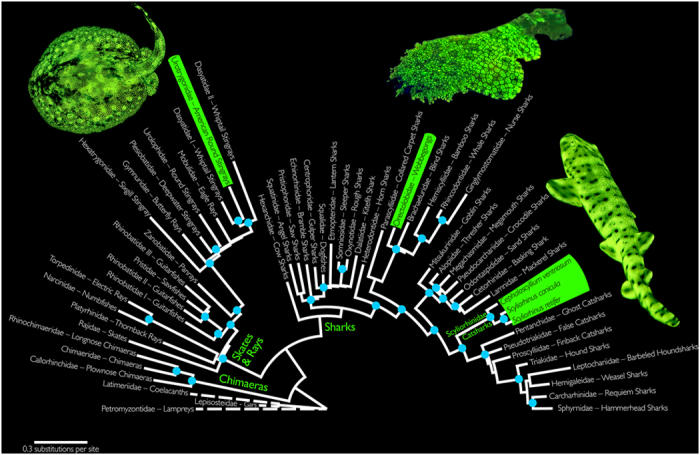
Figure 13. Family-level maximum likelihood phylogeny of elasmobranchs (species level phylogeny presented in Supp. Fig. 5).

Blue circles on nodes indicate bootstrap support values ≥70%. Representatives of the three known biofluorescent elasmobranch clades are highlighted in green. Outgroups are marked with dashed lines. Image of biofluorescent orectolobid © BioPixel.
