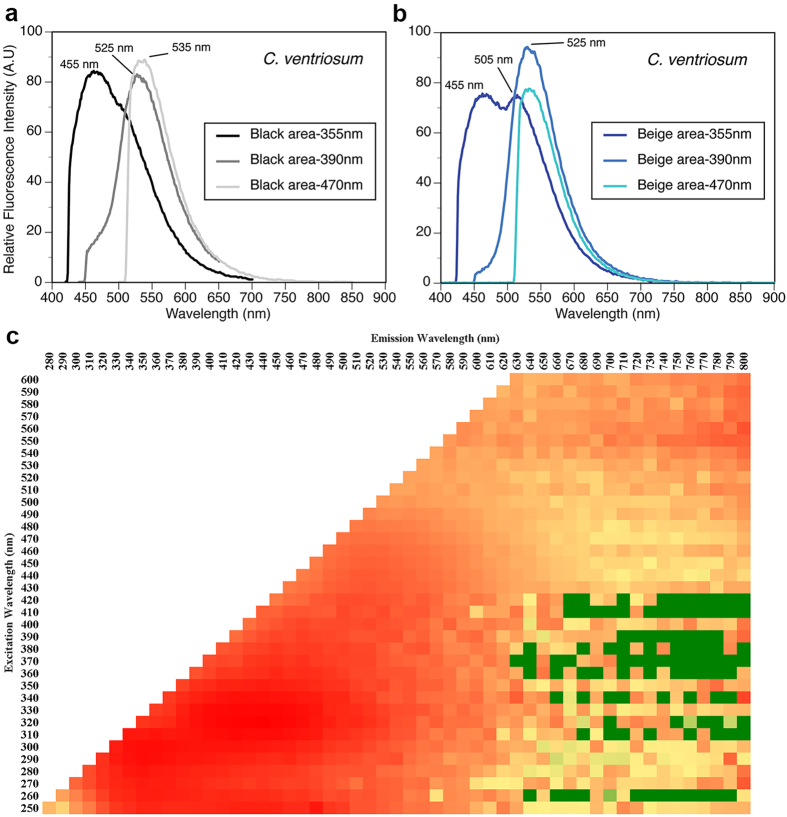
Figure 2. Spectral characterization of C. ventriosum.
(a) Fluorescence spectra following excitation at 355, 390, and 470 nm from black areas of the skin, using hyperspectral imaging analysis. (b) Same analysis from beige areas of the skin. (C) Excitation emission matrix (log scale representation) after extraction of fluorescent compounds from skin in methanol solvent, which included both black and beige areas.

