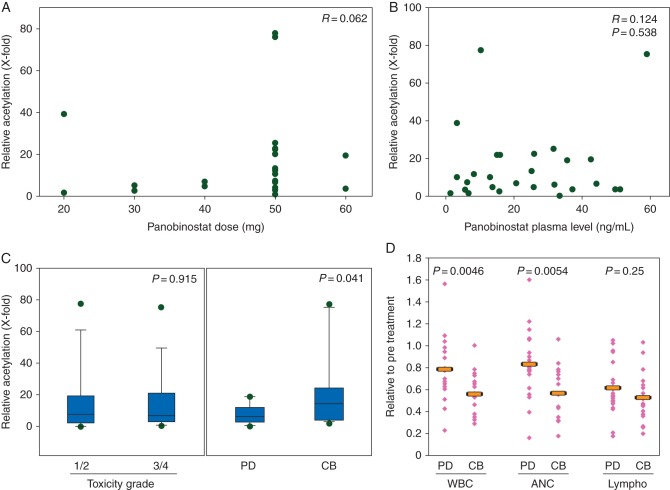
Figure 3.
Peripheral blood mononucleocyte histone acetylation relationship to panobinostat dose and plasma concentration, response, toxicity, and white cell count. Histone acetylation neither correlates with panobinostat dose (A) nor plasma concentration (ng/ml, B). (C) Box plots of histone acetylation in patients who did (CB) versus those who did not (PD) benefit from treatment and in patients who experienced grade 1/2 versus grade 3/4 toxicity. (D) Dot plots of all leukocytes (WBC), neutrophils (ANC), and lymphocytes (Lympho) on day 5 of treatment normalized to pretreatment on day 1 of cycle 1 comparing patients who did (CB) and did not (PD) benefit from treatment. The bar indicates the mean. Correlations were conducted using Pearson's correlation coefficient method.

