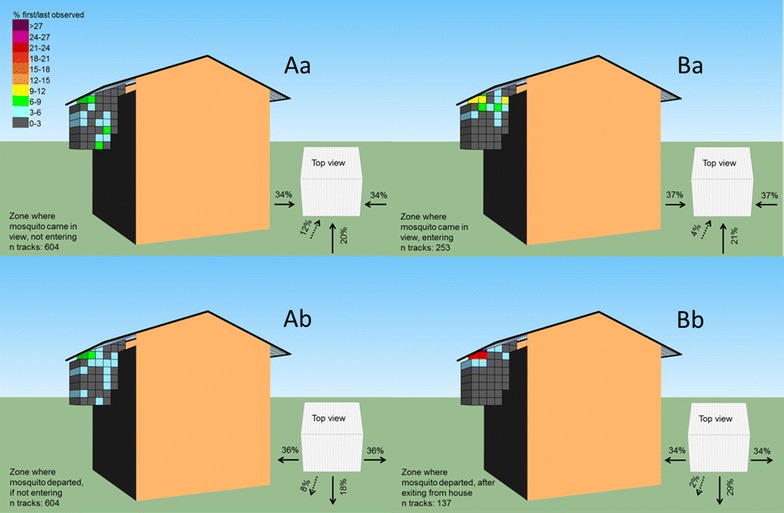
Fig. 2.

Observation arena where mosquitoes entered and left. The heat maps represent the frequency distribution in which zones mosquitoes were first or last observed within a reconstructed track. Aa and Ab represent mosquitoes that did not pass through the eave. Ba and Bb represent mosquitoes that passed through the eave. Top view images summarize the direction in which mosquitoes entered or left the area around the house
