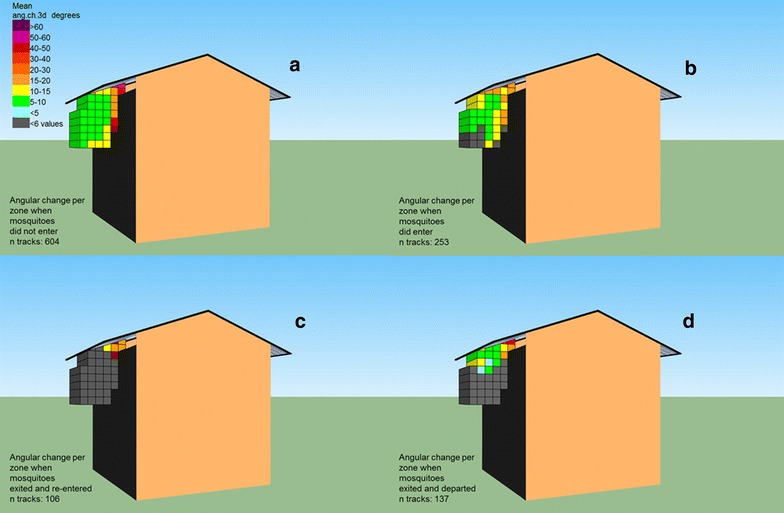
Fig. 5.

Mean angular change in 3D per zone measured in degrees. Higher values indicate a more convoluted flight path. The means per zone were analysed based on where mosquitoes entered or left the arena with a minimum of six different tracks per zone. a Not pass the eave, b pass the eave, c re-enter the eave after exiting, d exit and leaving the filmed area
