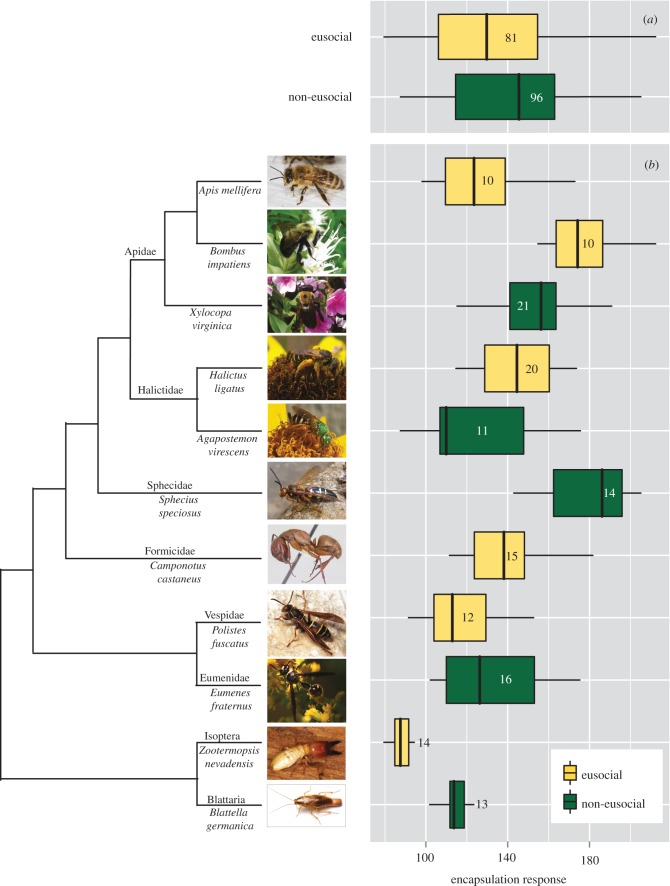
Figure 1.
Levels of encapsulation response quantified in eusocial and non-eusocial insect lineages. (a) Boxplot of the encapsulation response in eusocial (yellow) and non-eusocial (green) lineages. (b) Boxplot of the encapsulation response across the sampled insect lineages. Numbers in boxplots show sample size. Colony size, not eusociality, had a significantly negative effect on encapsulation response. See main text for details. Photo credits: Apis mellifera (Wikipedia), Bombus impatiens (Elsa Youngsteadt), Xylocopa virginica (Margarita M. López-Uribe), Halictus ligatus (Elsa Youngsteadt), Agapostemon virescens (Wikipedia), Sphecius speciosus (Elsa Youngsteadt), Camponotus castaneus (Wikipedia), Polistes fuscatus (Wikipedia), Eumenes fraternus (Wikipedia), Zootermopsis nevadensis (Will Chatfield-Taylor) and Blattella germanica (Matt Bertone).

