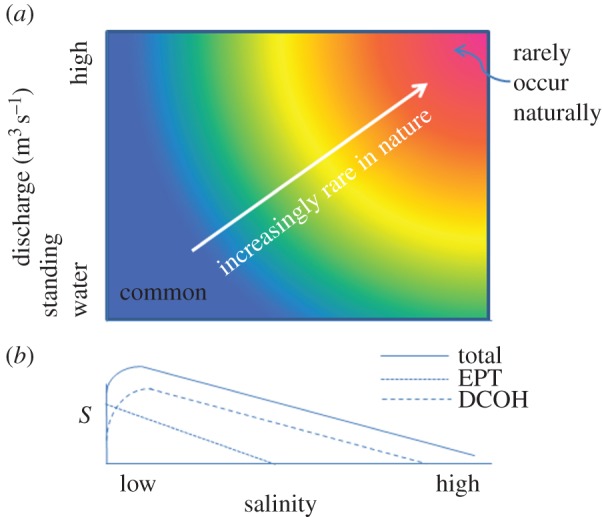
Figure 1.

Conceptual diagrams of the relationships between salinity and (a) discharge (m3 s−1)—with red indicating the salinity–flow combination is relatively rare, and blue that it is relatively common; (b) species richness (S) (i) for total invertebrates, (ii) Ephemeroptera, Plecoptera and Trichoptera (EPT) and (iii) Diptera, Coleoptera, Odonata and Hemiptera (DCOH).
