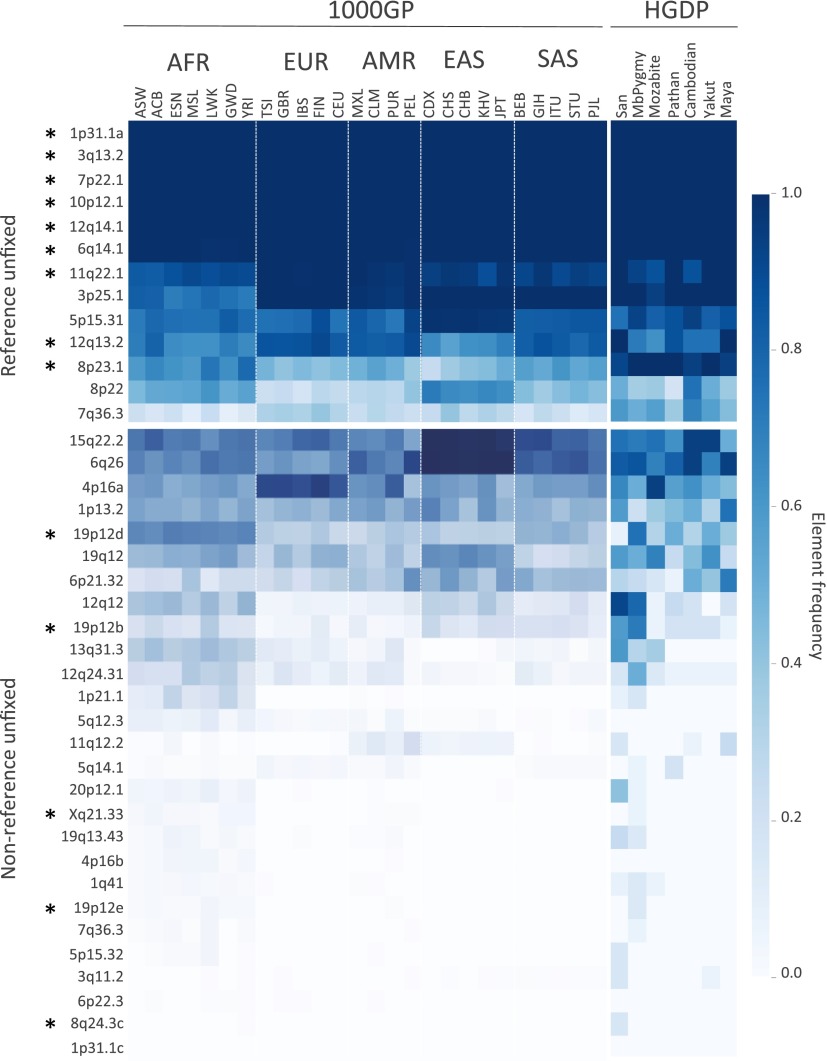
Fig. 2.
Estimated insertion allele frequencies of unfixed HML-2 insertions in humans. A total of 40 HML-2 loci were subjected to in silico genotyping: 13 sites represented the unfixed HML-2 loci from the hg19 reference, and 27 sites corresponded to nonreference polymorphic HML-2 reported here. Genotypes were inferred for each unfixed HML-2 locus across samples based on remapping of Illumina reads to reconstructed insertion or empty alleles corresponding to each site. Samples lacking remapped reads at a particular site were excluded from genotyping at that site. Allele frequencies were then calculated for each population as the total number of insertion alleles divided by total alleles. Allele frequencies are depicted as a heat map according to the color legend to the right. The 1KGP (1000GP) and HGDP populations are labeled above (also refer to Dataset S1 for population descriptors and other information). The locus of each of the unfixed HML-2 loci is labeled to the left according to its cytoband position. An asterisk is used to indicate insertions that have confirmed full-length copies. (Upper) Estimated distribution of reference unfixed HML-2 [from loci reported by Subramanian et al. (11) and Belshaw et al. (5)]. (Lower) Estimated distribution of nonreference HML-2 insertions. AFR, African; AMR, Admixed American; EAS, East Asian; EUR, European; SAS, South Asian.

