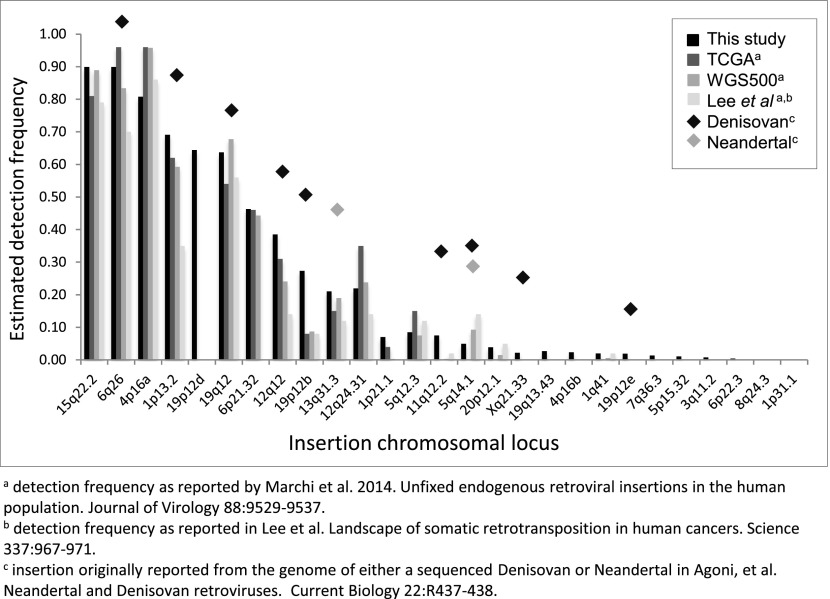
Fig. S5.
Comparison of the inferred presence of nonreference HML-2 insertions with other reports. Insertion frequencies were calculated as the proportion of individuals with evidence for the insertion, as estimated by remapping of local reads to reconstructed alleles representing the insertion and empty states across samples. Samples without read support at a given site were not included in calculations for that site. The obtained values are plotted for 27 nonreference HML-2 insertions identified in our analysis. Insertion detection frequencies from this analysis are plotted in black; frequencies inferred from similar analysis of sequenced genomes from 26 TCGA and 332 WGS500 samples [Marchi et al. (12)], and 44 sequenced clinical samples [Lee et al. (41)] are shown in gray as indicated in the key. Shaded diamonds are used to indicate elements also detected in the sequenced Neandertal and Denisovan genomes [Agoni et al. (42) and Lee et al. (51)].

