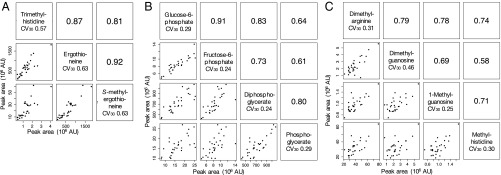
Fig. 2.
Clusters of human blood metabolites, defined by structure or function, show similar CVs. Blood data from all 30 volunteers revealed several groups of compounds with Pearson correlation coefficients of >0.7. Among these clusters were compounds related to ergothioneine (A), glycolytic pathway metabolites (B), and methylated compounds (C). Pearson correlation coefficients between pairs of compounds are shown in the upper right corners of the panels. In the lower left corners, actual compound levels are plotted for each pair.

