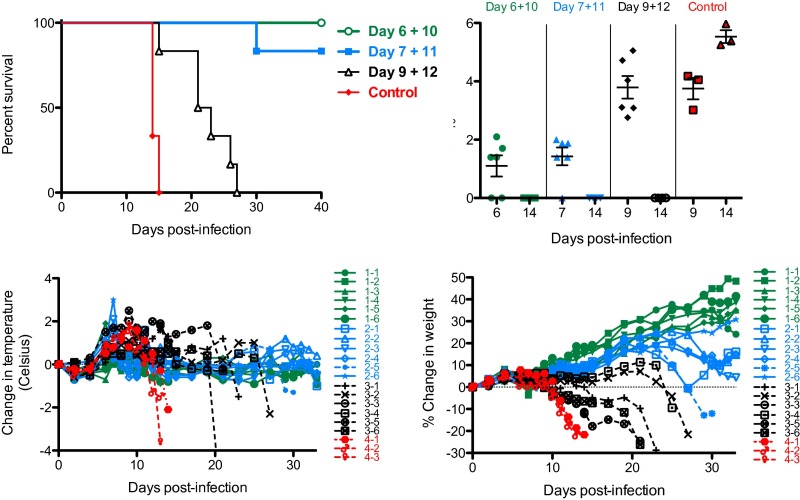
Fig. 3.
Therapeutic window study with J199. (Top Left) Survival of guinea pigs infected with JUNV. Animals (n = 6 per mAb-treated group; n = 3 for untreated controls) were treated with 10 mg of J199 at different points after infection. (Top Right) Plasma viral load as determined by plaque assay. Day 6, 7, and 9 samples were obtained before dosing with mAb. (Bottom Left) Change in temperature over time. (Bottom Right) Percent change in weight over time. In the bottom graphs, dashed lines indicate data curves from animals that succumbed to infection. 1–1 through 1–6 indicate the six individual animals in the Day 6+10 treatment group; 2–1 through 2–6 for the Day 7+11 group; 3–1 through 3–6 for the Day 9+12 group; and 4–1 through 4–3 for the three animals in the control group.

