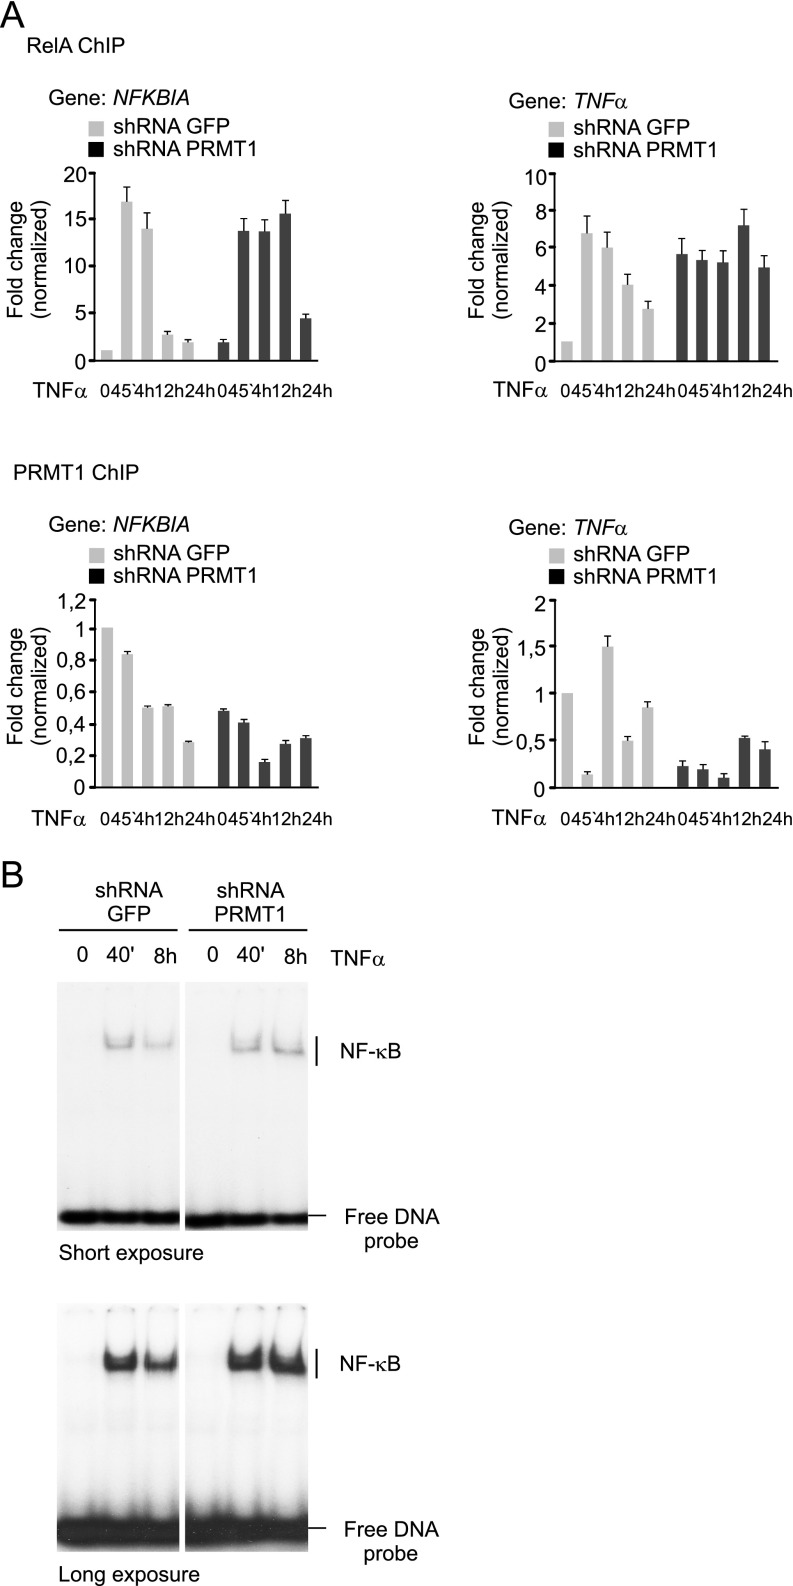
Fig. S7.
(A) ChIP signals presented in Fig. 5D, normalized to inputs and quantified using ImageJ 1.49 software. (B) EMSA of nuclear extracts obtained from the control or shRNA PRMT1-expressing HEK 293T cells treated with 20 ng/mL TNFα for the indicated times. Distinct parts of the representative gel are separated by white spaces.

