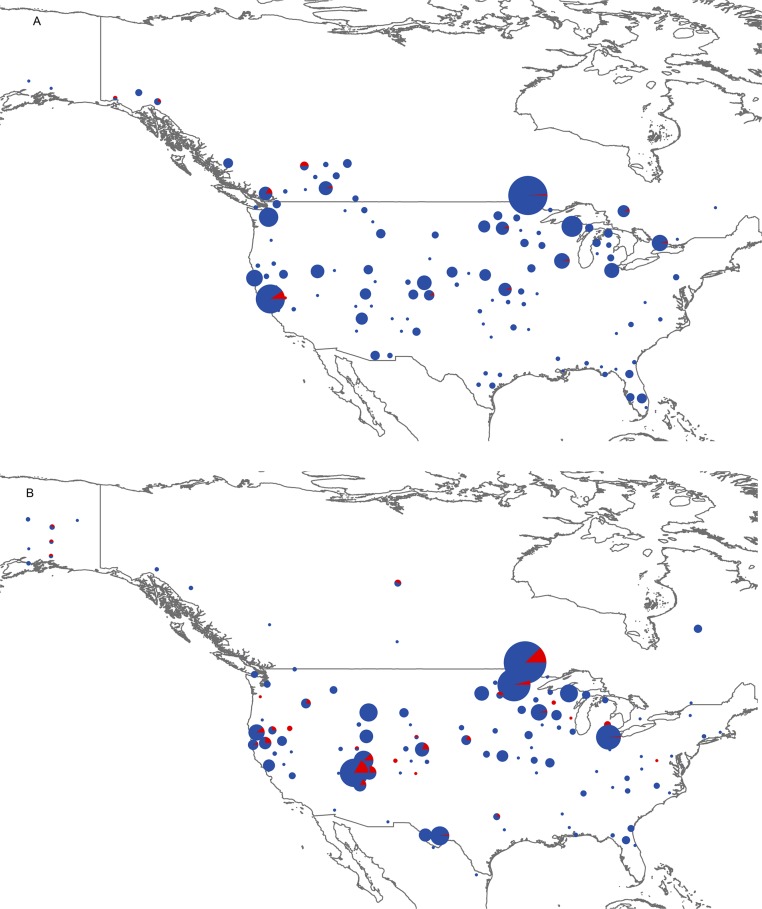
Fig. S1.
Pie charts showing spatial distributions of infected (red) or uninfected (blue) bumble bees for all five North American study species combined. Bees were collected between 1979 and 1991 (A) and between 1992 and 2011 (B). The largest circle in A represents 157 bees, and the largest circle in B represents 187 bees.

