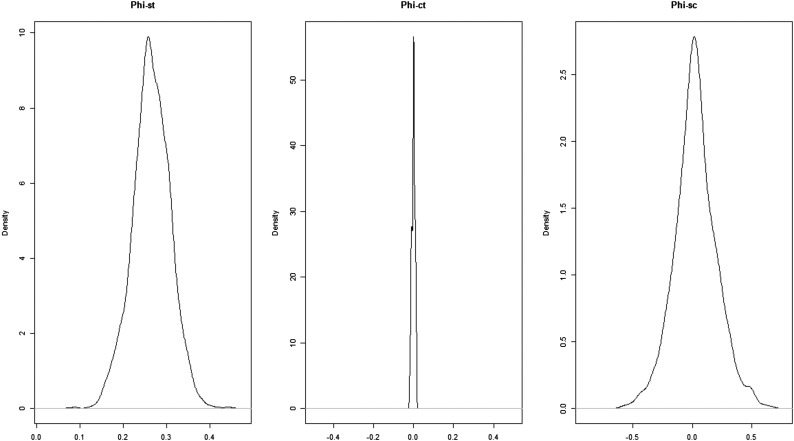
Fig. S5.
Kernel density plots of ΦST (among-isolate genetic variation), ΦCT (between-group genetic variation), and ΦSC (within-group, among-isolate genetic variation) calculated by hierarchical analysis of molecular variance. The analysis was based on data from six variable loci from 31 N. bombi isolates.

