Fig. 5.
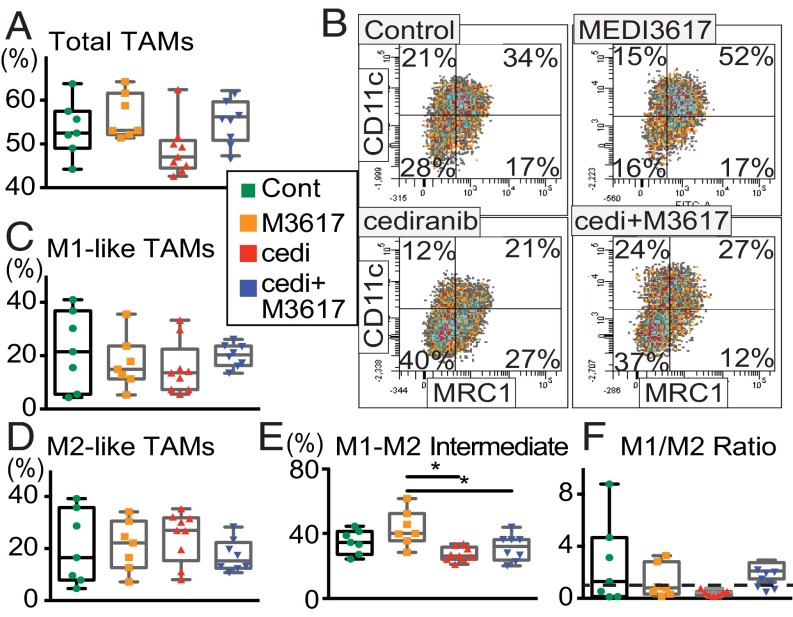
Cediranib and MEDI3617 have differential effects on TAM recruitment and polarization in Gl261 tumors. Immune cell profiles in Gl261 tumors were analyzed by flow cytometry on day 10. (A) The percentage of F4/80+ TAMs was significantly different among treatment groups (ANOVA P = 0.046; n = 7 or 8). Cediranib monotherapy tended to reduce the percentage of TAMs compared with MEDI3617 monotherapy and dual therapy (P = 0.054 and P = 0.096, respectively). (B) Representative images of the gating strategy to define TAM phenotypes for each treatment group. TAMs were defined as one of four phenotypes: M1-like TAM (CD11c+MRC1−), M2-like (CD11c−MRC1+), M1–M2 intermediate (CD11c+MRC1+), and double-negative (CD11c−MRC1−) TAMs. (C) There was no significant difference among treatment groups in the percentage of M1-like TAMs. (D) There was no significant difference among any of the groups in the percentage of M2-like TAMs. (E) There was a significant difference among treatment groups in the percentage of M1–M2 intermediate TAMs that did not display clear M1- or M2-like activation (ANOVA P = 0.0031). Furthermore, both cediranib monotherapy and dual therapy significantly reduced the percentage of these TAMs compared with MEDI3617 monotherapy (*P = 0.0019 and *P = 0.029). (F) There was a trend toward a difference among treatment groups in the M1/M2 ratio (Kruskal–Wallis test, P = 0.098). Dual therapy tended to increase M1/M2 ratio compared with cediranib monotherapy (P = 0.053). The dashed line indicates an M1/M2 ratio of 1. Total TAMs were normalized to CD45+ cells for comparisons among treatment groups. All TAM phenotypes described were normalized to total F4/80+ cells for comparisons among treatment groups. Error bars represent the SEM.

