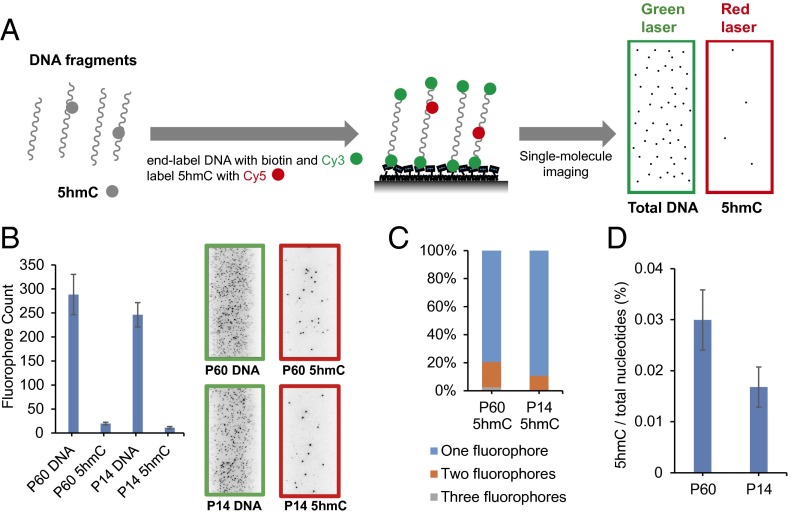
Fig. 1.
Single-molecule imaging of 5hmC. (A) General procedure for single-molecule imaging of 5hmC. DNA fragments are end-labeled with biotin and Cy3, and 5hmC is labeled with Cy5. The labeled DNA is immobilized to the microscope slide and imaged with single-molecule TIRF microscopy. (B) Fluorophore counts of labeled P60 and P14 mouse cerebellum genomic DNA with example images shown on the right. (C) Distribution of multiple fluorophores on DNA fragment of mouse cerebellum when detecting 5hmC. (D) The 5hmC level of mouse cerebellum DNA. Error bars, mean ± SD (n = 15 counting regions).

