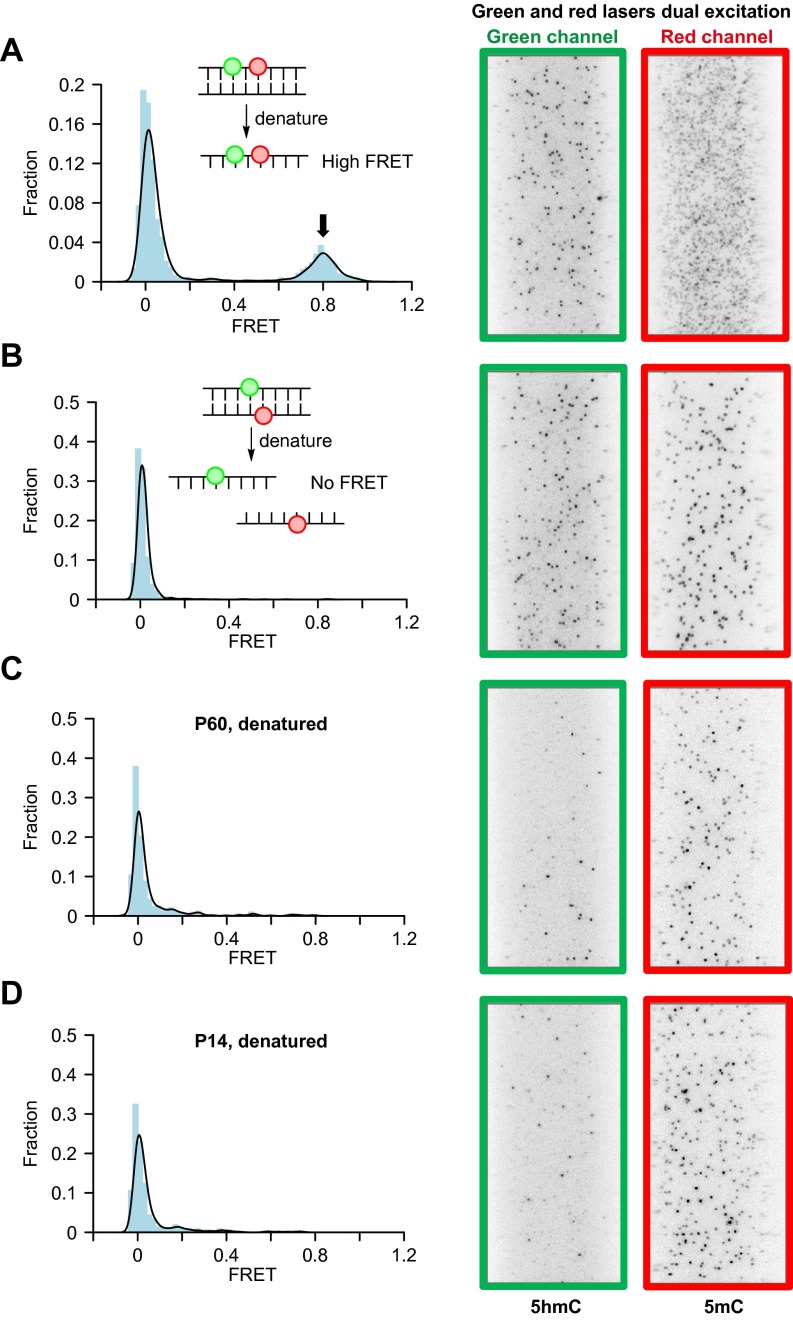
Fig. S5.
smFRET distributions and example images of denatured samples. (A) Denatured dual-labeled synthetic DNA with 5mC and 5hmC separated with 1 bp in the same strand. (B) Denatured dual-labeled synthetic DNA with 5hmC/5mCpG site. (C) Denatured dual-labeled mouse P60 cerebellum genomic DNA. (D) Denatured dual-labeled mouse P14 cerebellum genomic DNA. Each panel has smFRET distribution on the left and dual excitation example images on the right showing the fluorophore labeling remains after denaturing. Arrows indicate FRET peak.

