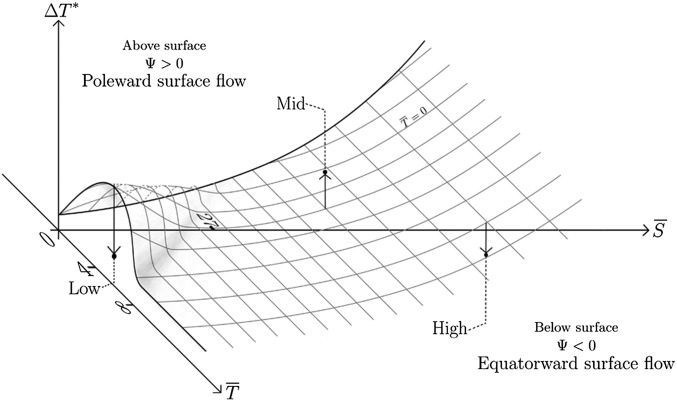
Fig. 2.
A schematic illustrating the direction and magnitude of the overturning circulation, , from the box model solutions. The behavior depends on the values of temperature gradient forcing , the mean temperature , and mean salinity . The proportionality between the salinity gradient forcing and means the two values do not need separate consideration, whereas and can be varied independently. Note the lower limit of decreases as increases and lowers the freezing point. Values lying on the surface have zero circulation ; those above and below have positive and negative circulation, respectively, with increasing magnitude with increasing distance from the surface. The values defining the low-salinity, low-temperature range are indicated; 0–8 °C and 0–27 g⋅kg−1, with the local maximum at 4 °C, 0 g⋅kg−1. The locations of the low, mid-, and high salinity ranges considered in this study are indicated in reference to the surface. The curvature of the surface results from the nonlinear dependence of density on temperature and salinity.

