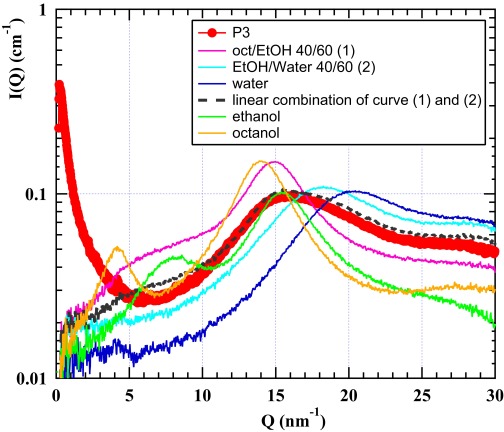
Fig. S3.
The WAXS part obtained from the sample P3 in linear scale (red) is shown, with the enlargement of the broad liquid band obtained at Q = 1.5 Å−1, compared with the scattering in the same region produced by the two pseudophases in equilibrium [mixture of ethanol and water with a volume fraction ratio of 40:60 (light blue) and mixture of octanol and ethanol with a volume fraction ratio of 40:60 (purple)] as well as from several pure solutions: pure water (blue), pure octanol (orange), and pure ethanol (green). The dotted black line represents a linear combination of both reference mixtures to adjust the SWAXS contribution of the surfactant-free microemulsion.

