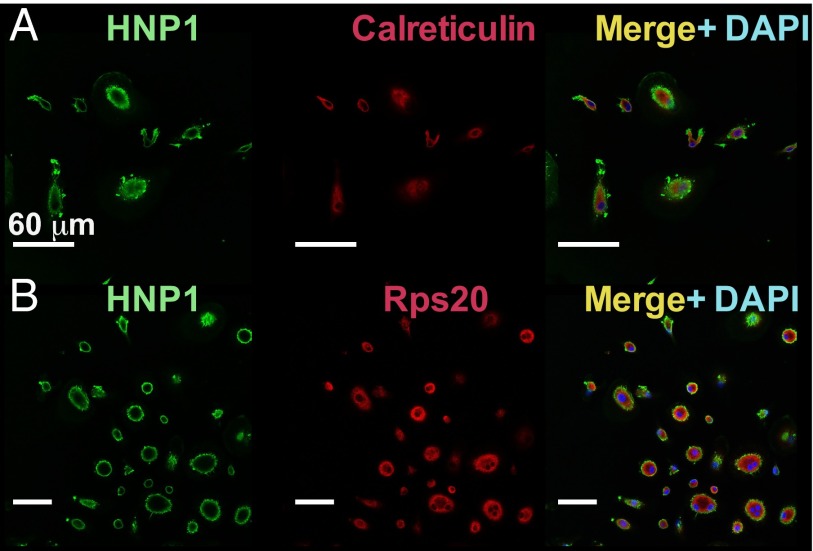
Fig. 2.
HNP1 enters HMDMs. Confocal microscopy images of HNP1-treated HMDMs before visualization of anti-HNP1 (green) and DAPI (blue) seen on the merged images. In addition, red secondary staining indicates calreticulin (specific for the ER) in A and the ribosomal-associated protein Rps20 in B. Representative images are from one of six independent experiments. (White scale bars, 60 μm.)

