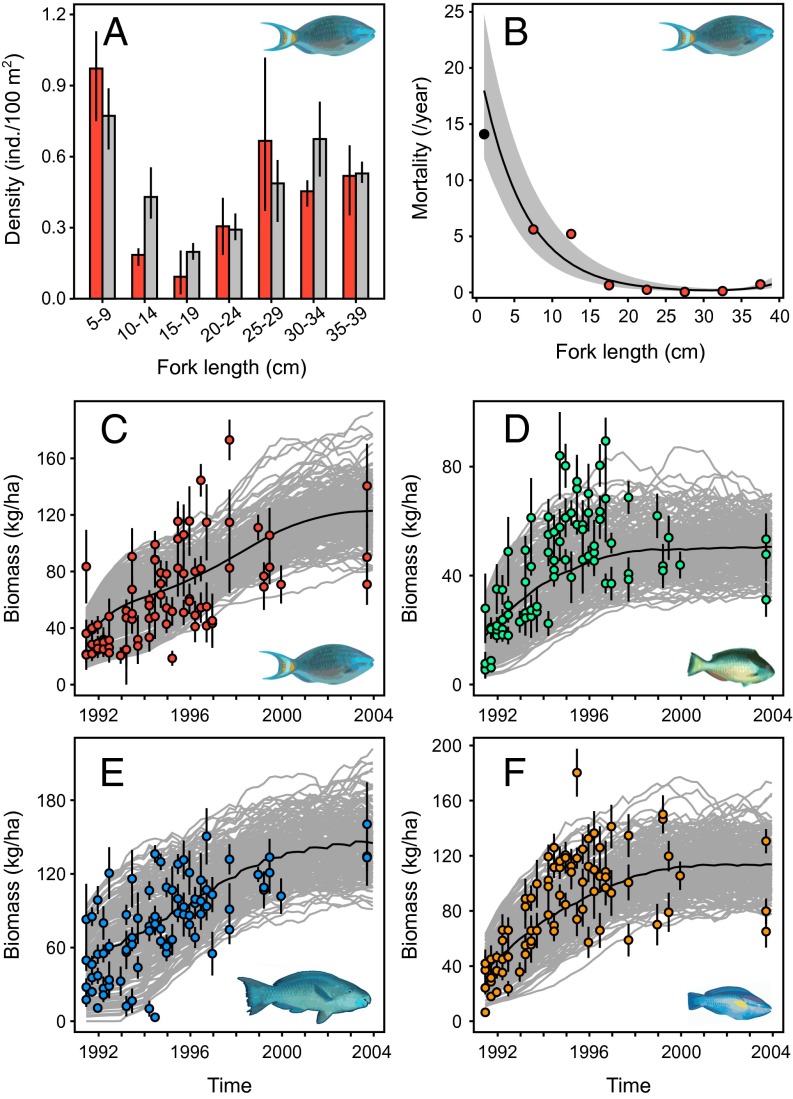
Fig. 1.
Parrotfish population modeling. (A) Structure of the stoplight parrotfish (Sparisoma viride) population observed in Bonaire in 1989–1992 [red bars (22, 23)] and predicted by the best-fit model at equilibrium (gray bars). Error bars are SEs estimated by bootstrap. (B) Size-specific natural mortality of the stoplight parrotfish as estimated in Bonaire by the best-fit predictions. The gray envelope represents the normal 95% confidence interval of model estimates. Red dots indicate previous mortality estimates (24) obtained with the same survey data, and the black dot is an empirical estimate of recruit mortality of Sparisoma spp. from Barbados (45). (C−F) Biomass recovery of the stoplight (C), redband (Sparisoma aurofrenatum) (D), queen (Scarus vetula) (E), and princess (Scarus taeniopterus) (F) parrotfishes in Bermuda after cessation of trap fishing in April 1990. Dots represent observations averaged over 3-mo periods; error bars indicate the associated SEs. Gray lines show the individual (200 stochastic) simulations, and black lines show average simulated trajectories.

