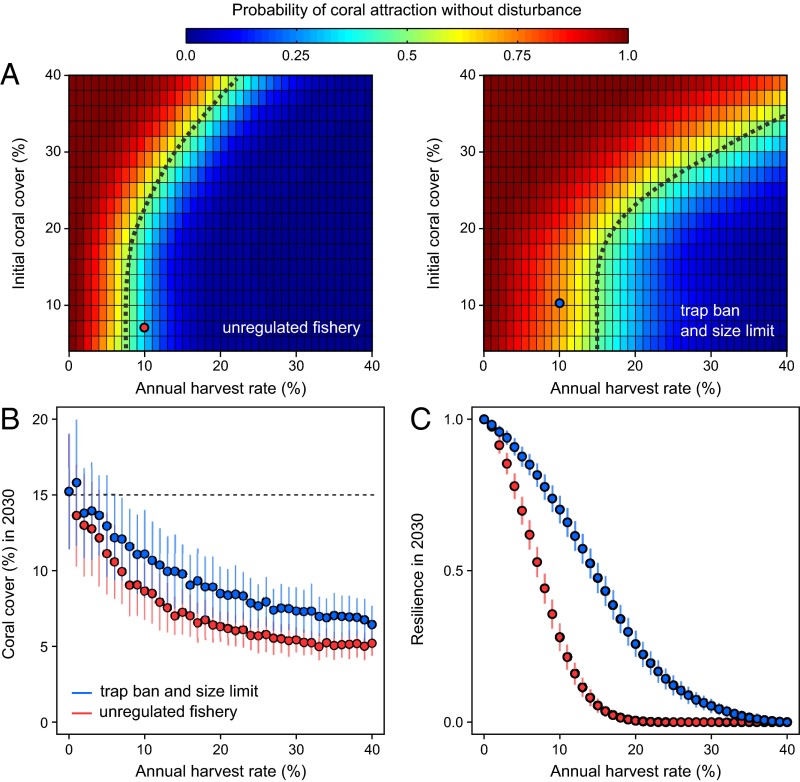
Fig. 3.
Fishing impacts on coral reef resilience. (A) Reef phase portraits showing the probability of coral attraction (i.e., net coral growth) without external disturbances for the 15-cm (Left) and 30-cm (Right) size selectivity. The probability of coral attraction is quantified by the proportion of reef simulations (n =100) with an upward coral trajectory for various initial coral covers and harvest rates. The dotted line delineates the position of unstable equilibria where the probability of coral attraction is 0.50. (B) Projections of average coral cover in 2030 for incremental harvest rates with an initial 15% coral cover (dotted line) and a representative regime of hurricanes and coral bleaching for the Caribbean. (C) Reef resilience by 2030, estimated as the average probability of coral attraction at the end of the climate change scenario, based on the hysteresis plots and the projections of reef state and harvest rate. The limits of confidence envelops represent the SD of model outputs (n = 100 simulations). In A–C the red and blue dots indicate a projected reef in 2030 with a 10% harvest rate for the 15-cm (∼28 kg⋅ha−1⋅y−1) and 30-cm (∼34 kg⋅ha−1⋅y−1) size-selectivity scenarios, respectively.

