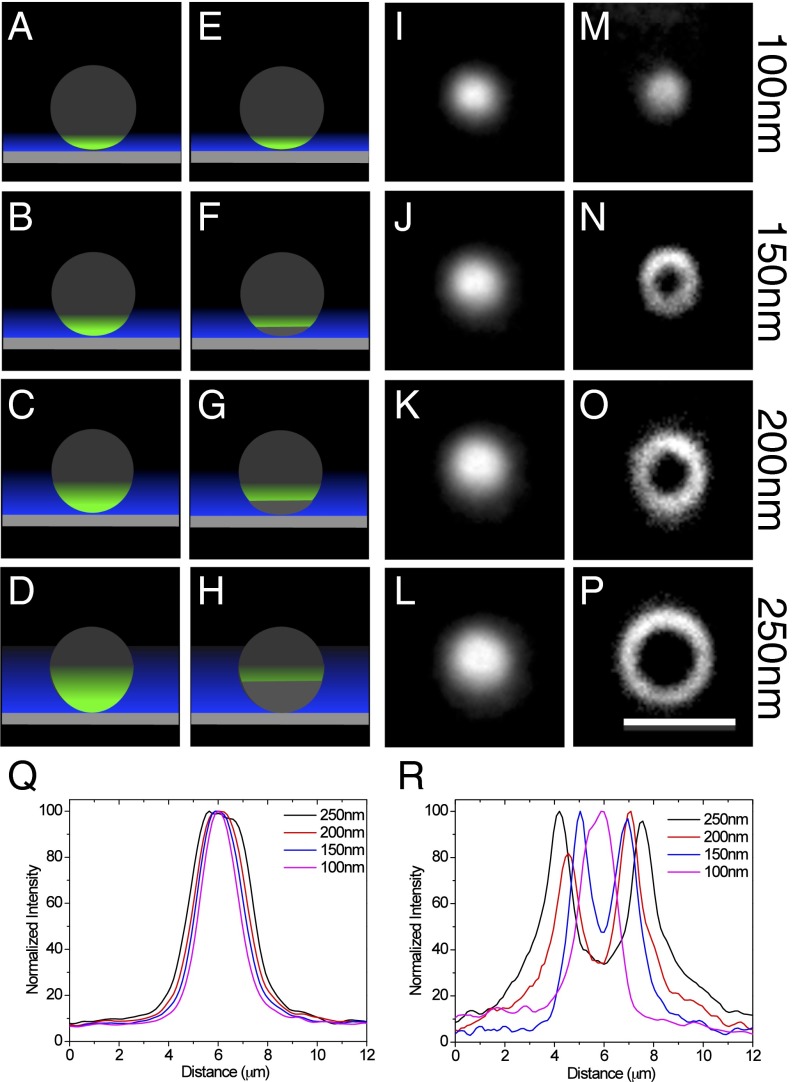
Fig. 1.
Multiangle TIRF images of beads with and without sequential imaging and photobleaching. (A–H) Schematic of the imaging protocols using multiangle TIRF illumination. (A–D) A fluorescent sphere placed on a coverglass (gray rectangle) is imaged using TIRF excitation (blue) at decreasing angles of incidence, which results in increasing evanescent field depths (blue). As the depth increases, more of the object is illuminated and the fluorescence signal is observed as a spot in the image that is increasing in diameter. (E–H) The fluorescent sphere is imaged at the highest angle of incidence (smallest TIRF depth) and photobleached at that angle before moving to the next angle. This is repeated for each angle. The signal is observed as a ring of fluorescence that is increasing in diameter with increasing TIRF depth. (I–P) Silica beads (diameter, 7.27 µm; refractive index, 1.42) were labeled with purified mCherry and imaged using different incident beam angles corresponding to the calculated penetration depths indicated (I–L) and imaged using the image-photobleach-image protocol at the calculated penetration depths indicated (M–P). (Q) Plot profiles of the beads in I–L were used to determine the dimensions of the bead fluorescence signals. Based on the geometry of the beads (SI Appendix, Fig. S3B), the measured penetration depths for the theoretically calculated values were 109.2 nm for 100 nm, 154.3 nm for 150 nm, 196.6 nm for 200 nm, and 278.9 nm for 250 nm. (R) Plot profiles of the beads in M–P were used to determine the dimensions of the bead fluorescence signals. Using the distance of two peaks as the diameters of imaged beads (SI Appendix, Fig. S3C), the measured penetration depths for the theoretically calculated values were 99.4 nm for 100 nm, 130.4 nm for 150 nm, 205.9 nm for 200 nm, and 385.1 nm for 250 nm. (Scale bar: 5 µm.)

