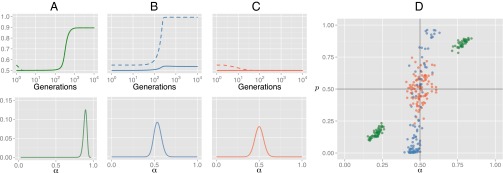
Fig. 2.
Evolution in model 2. (A−C) Equilibrium distribution of priors α (Lower) and timecourse dynamics (Upper) for the mean of the population’s prior (α, solid lines) and expected use of ordering (p, dashed lines), in acultural (A), and cultural (B, MAP learners; C, sample learners) populations. (D) Results of 300 agent-based simulations of the model (100 acultural, 100 MAP, 100 Sample) in populations of 100 learners after 1,000 generations: Points show the mean of the population’s prior (α) and expected use of ordering (p) in the final population;.

