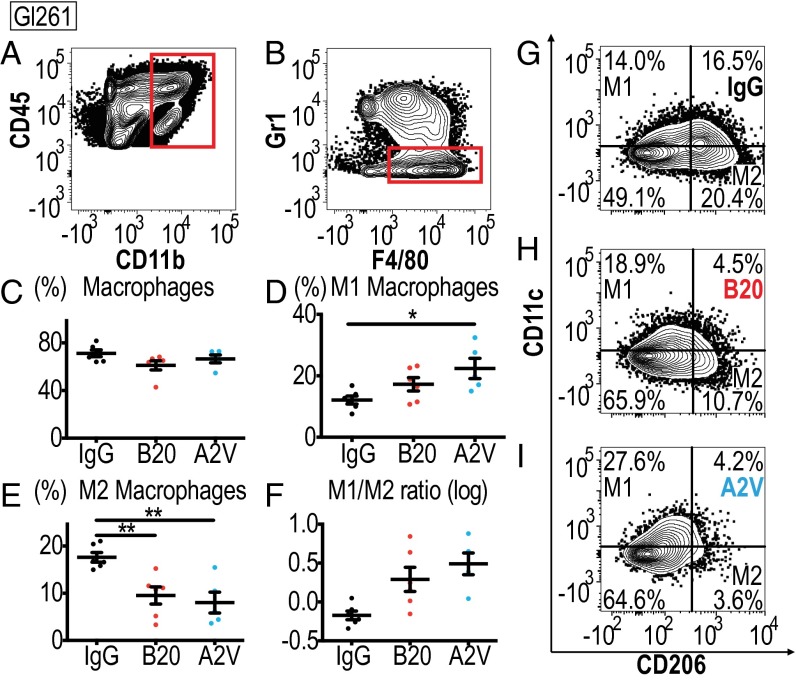
Fig. 4.
In the Gl261 model treatment with A2V shifts TAMS toward the M1 state. In all panels, IgG, n = 6; B20, n = 6; A2V, n = 5. (A and B) Gating through CD45high/CD11b+ and F4/80+/GR1− identified macrophages. (C) Treatment with A2V or B20 did not lead to significant changes in the total percentage (percent of all CD45pos cells) of Gl261 tumor-infiltrating macrophages compared with IgG control. (D) The percentage of CD206low/CD11chigh M1-polarized macrophages (as a percentage of total macrophages) was increased in A2V-treated Gl261 tumors as compared with IgG-treated tumors (*P = 0.02). (E) CD206high/CD11clow M2 macrophages were decreased by A2V treatment compared with IgG treatment (**P = 0.004). B20 therapy decreased M2 macrophages compared with IgG therapy (**P = 0.01). (F) The M1/M2 ratio showed a trend toward the M1 polarization state in A2V-treated animals compared with IgG-treated animals. (G–I) Representative gates for IgG (G), B20 (H), and A2V (I) to identify M1 and M2 macrophages.

