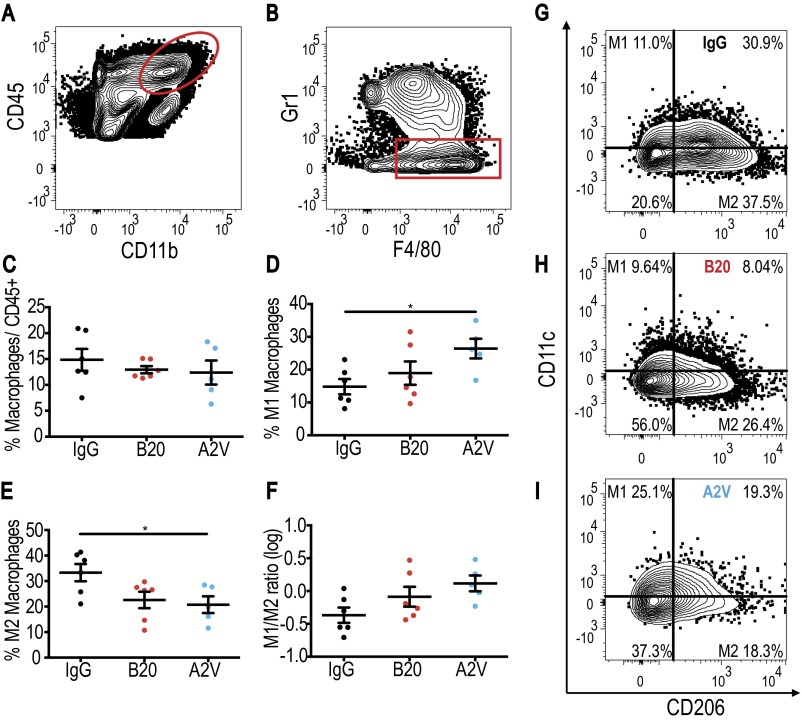
Fig. S7.
Treatment with B20 and A2V skews macrophages toward the M1 phenotype in Gl261 tumors. In all panels, IgG, n = 6; B20, n = 6; A2V, n = 5. (A and B) Gating through CD45high/CD11b+ (A) and F4/80+/GR1− (B) identified macrophages. (C) The total percentage of macrophages was not changed by treatment. (D) M1 macrophages were increased by A2V treatment compared with IgG treatment (*P = 0.05). (E) M2 macrophages were reduced by treatment with A2V compared with IgG treatment (*P = 0.05). (F) The M1/2 macrophage ratio trended toward an increase in M1 under A2V treatment as compared with IgG treatment. (G–I) Representative gates for IgG (G), B20 (H), and A2V (I).

