Fig. 2.
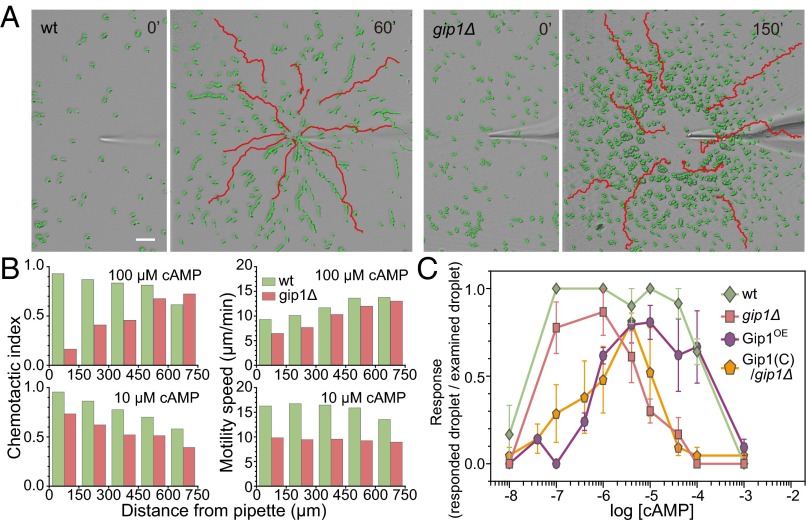
Chemotactic dynamic range is extended to higher concentrations via Gip1. (A) Chemical gradients were applied to WT and gip1Δ cells from a micropipette tip filled with 100 μM cAMP. Representative images of cell trajectories (red lines) are shown before (0') and 60 or 150 min after (60' and 150', respectively) the start of the assay. Cells are highlighted in green. (Scale bar, 50 µm.) (B) CI and motility speed were calculated from the assay in A following application of 10 or 100 μM cAMP at different distances from the micropipette tip. Each bar represents the average of at least 10 cells. (C) The chemotactic response to different cAMP concentrations was evaluated by the small population assay (Fig. S2B). Data represent the mean ± SEM of three experiments.

